Fig. 4
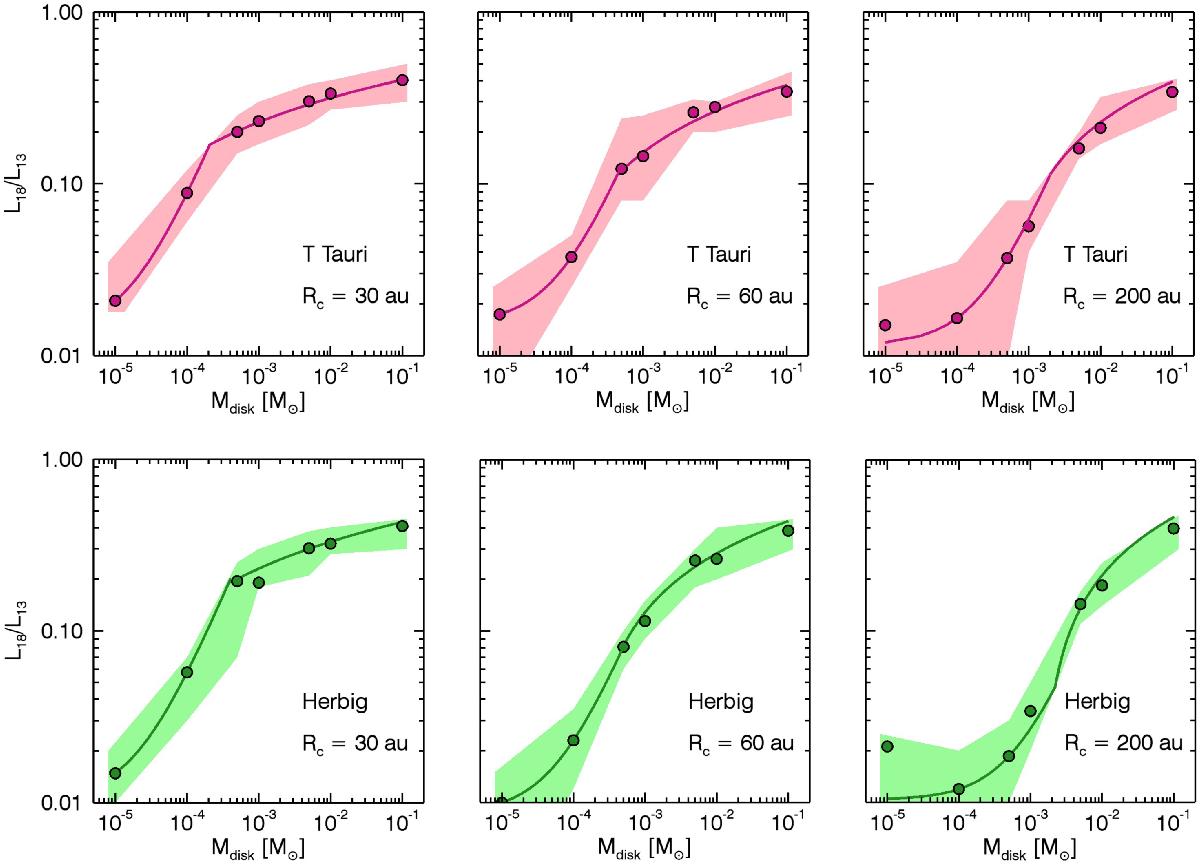
Line ratios of C18O/13CO (J = 2−1), defined as L18/L13, as function of disk masses for models where i = 10°. The top panels report the results for T Tauri disk models and lower panels those for Herbig disk modelsl. Left, middle and right panels present results for models with respectively Rc = 30 au, Rc = 60 au, and Rc = 200 au. Each point reports the result for the median line ratio in each mass bin. The continuous solid lines show the fit function reported in Eq. (3). The filled regions show the standard deviation from the median values.
Current usage metrics show cumulative count of Article Views (full-text article views including HTML views, PDF and ePub downloads, according to the available data) and Abstracts Views on Vision4Press platform.
Data correspond to usage on the plateform after 2015. The current usage metrics is available 48-96 hours after online publication and is updated daily on week days.
Initial download of the metrics may take a while.