Fig. 6
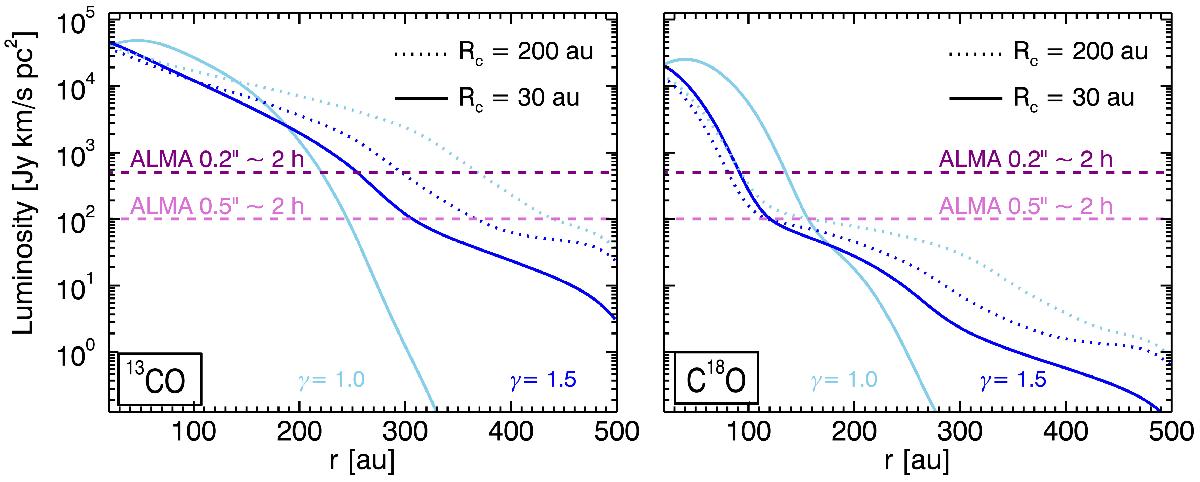
Radial profile of 13CO and C18O J = 2−1 lines for four T Tauri models where ψ = 0.1, hc = 0.1, Mdisk = 10-3 M⊙ and Rc and γ assume different values. Models with γ = 1.5 are presented in dark blue, while those with γ = 1.0 are shown in light blue. Solid lines displays models with Rc = 30 au and dotted lines represents those with Rc = 200 au. These line profiles are obtained assuming a distance of 100 pc, an inclination angle i = 10°, and by convolving the output images by a 0.5′′ beam. The horizontal dashed lines show the typical ALMA sensitivity for an integration time of 1.84 h on source for a 0.2′′ beam (purple line) and for a 0.5′′ beam (pink line), given a spectral resolution of 1.3 km s-1.
Current usage metrics show cumulative count of Article Views (full-text article views including HTML views, PDF and ePub downloads, according to the available data) and Abstracts Views on Vision4Press platform.
Data correspond to usage on the plateform after 2015. The current usage metrics is available 48-96 hours after online publication and is updated daily on week days.
Initial download of the metrics may take a while.