Fig. 8
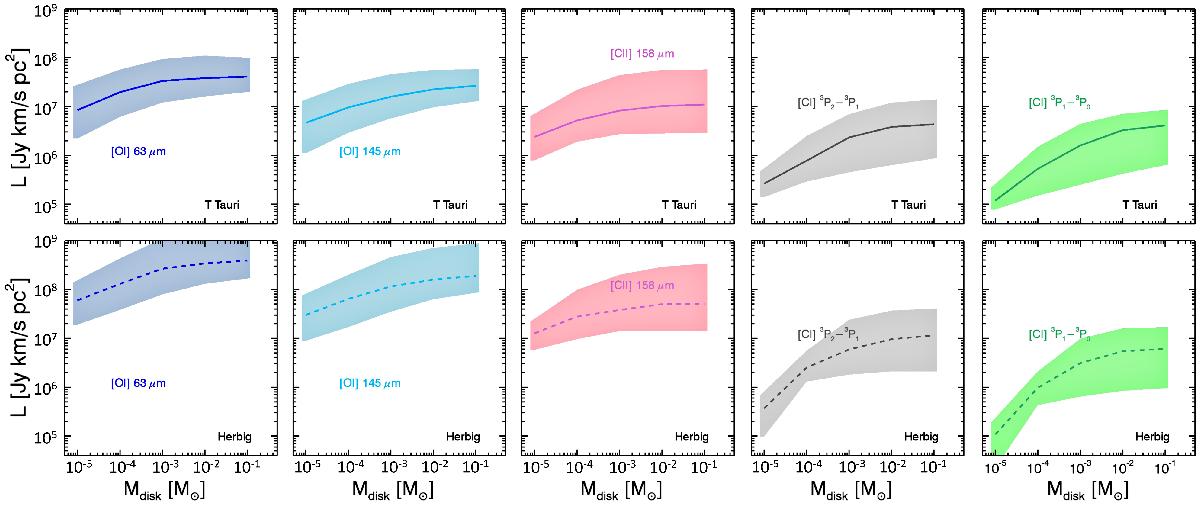
Median luminosities for [O i], [C i] and [C ii] lines as a function of disk mass. Each line transition is shown by a differently colored line. Solid lines show T Tauri disk models (top panels), while dashed lines present Herbig disk models (bottom panels). The filled regions show the maximum range of the line luminosities obtained with different models.
Current usage metrics show cumulative count of Article Views (full-text article views including HTML views, PDF and ePub downloads, according to the available data) and Abstracts Views on Vision4Press platform.
Data correspond to usage on the plateform after 2015. The current usage metrics is available 48-96 hours after online publication and is updated daily on week days.
Initial download of the metrics may take a while.