Free Access
Fig. 1
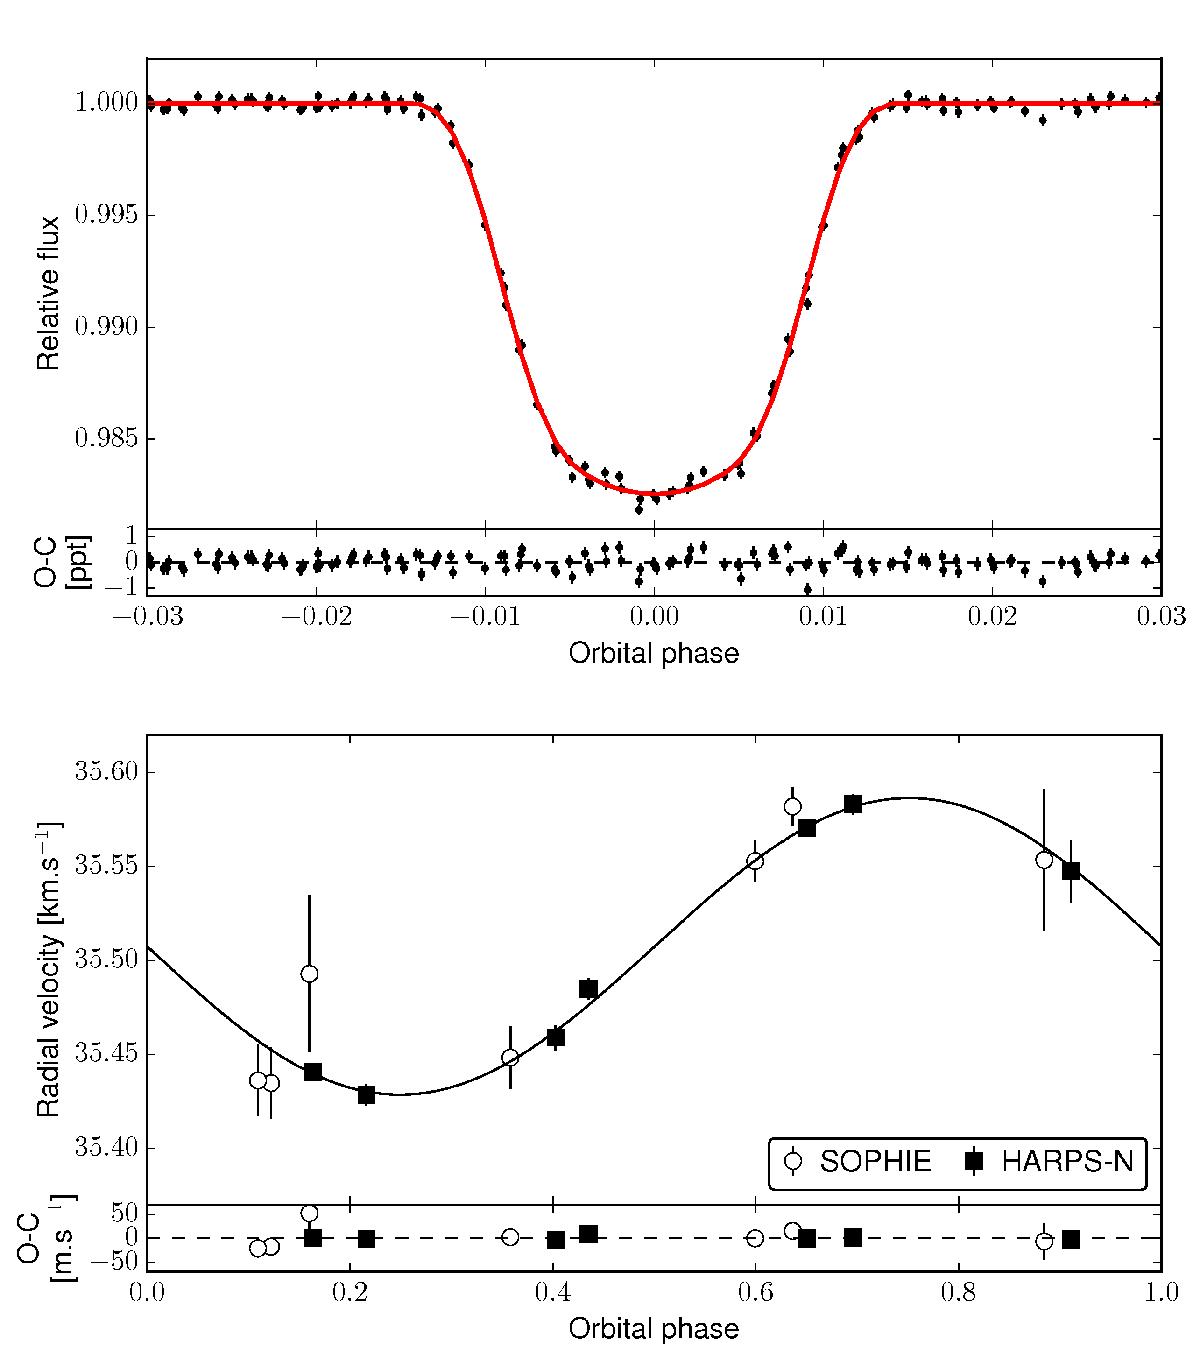
Results of the joint analysis with PASTIS for K2-30, including the primary transit (top panel) and radial velocity (bottom panels). The final models are shown with solid lines and the residuals of the data are presented in the lower part of each panel.
This figure is made of several images, please see below:
Current usage metrics show cumulative count of Article Views (full-text article views including HTML views, PDF and ePub downloads, according to the available data) and Abstracts Views on Vision4Press platform.
Data correspond to usage on the plateform after 2015. The current usage metrics is available 48-96 hours after online publication and is updated daily on week days.
Initial download of the metrics may take a while.