Fig. 10
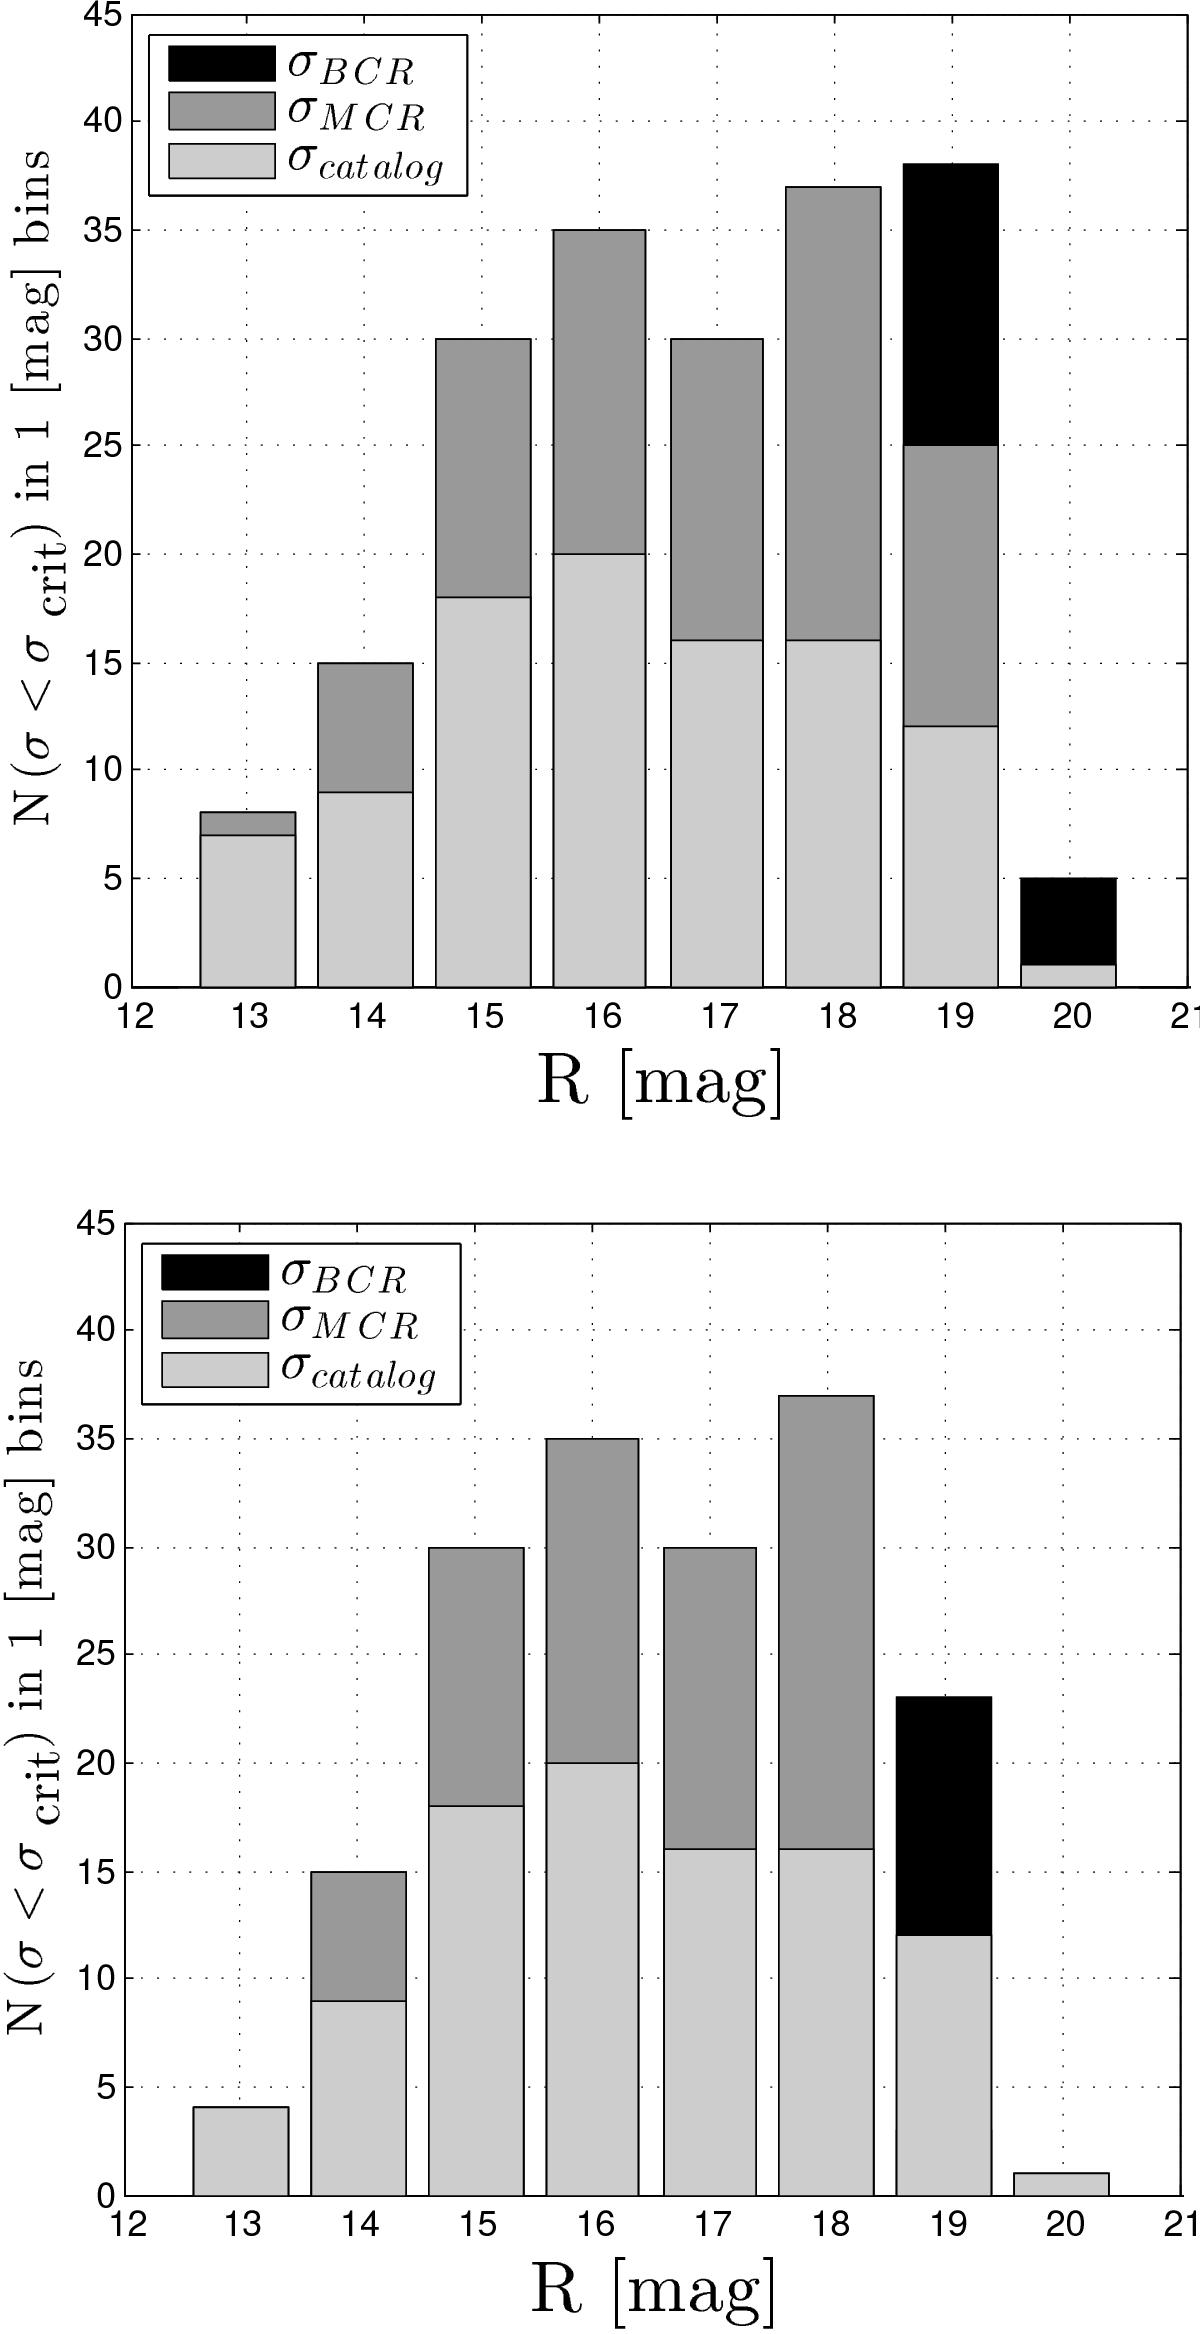
Similar to Fig. 9, except that both panels are the predictions for observations with a 1 m class telescope. The upper panel is for a FWHM of 1.2 arcsec, while the lower panel is for a FWHM of 2.0 arcsec. As the quality of the new observations degrades, their contribution to the sample, as well as that using prior information, is displaced to brighter magnitudes. The gain from using the information in the catalog is relevant in both cases at the faintest bins, as in Fig. 9: at 19th magnitude we have 38 objects in the Bayesian scenario, and 25 objects in the parametric approach, i.e., an increase of more than 50% for the upper panel. In the lower panel the increase is even more important: 23 objects in the Bayesian approach and 12 from the catalog (equal to the number from MCR), an increase of ~90%.
Current usage metrics show cumulative count of Article Views (full-text article views including HTML views, PDF and ePub downloads, according to the available data) and Abstracts Views on Vision4Press platform.
Data correspond to usage on the plateform after 2015. The current usage metrics is available 48-96 hours after online publication and is updated daily on week days.
Initial download of the metrics may take a while.