Free Access
Fig. 4
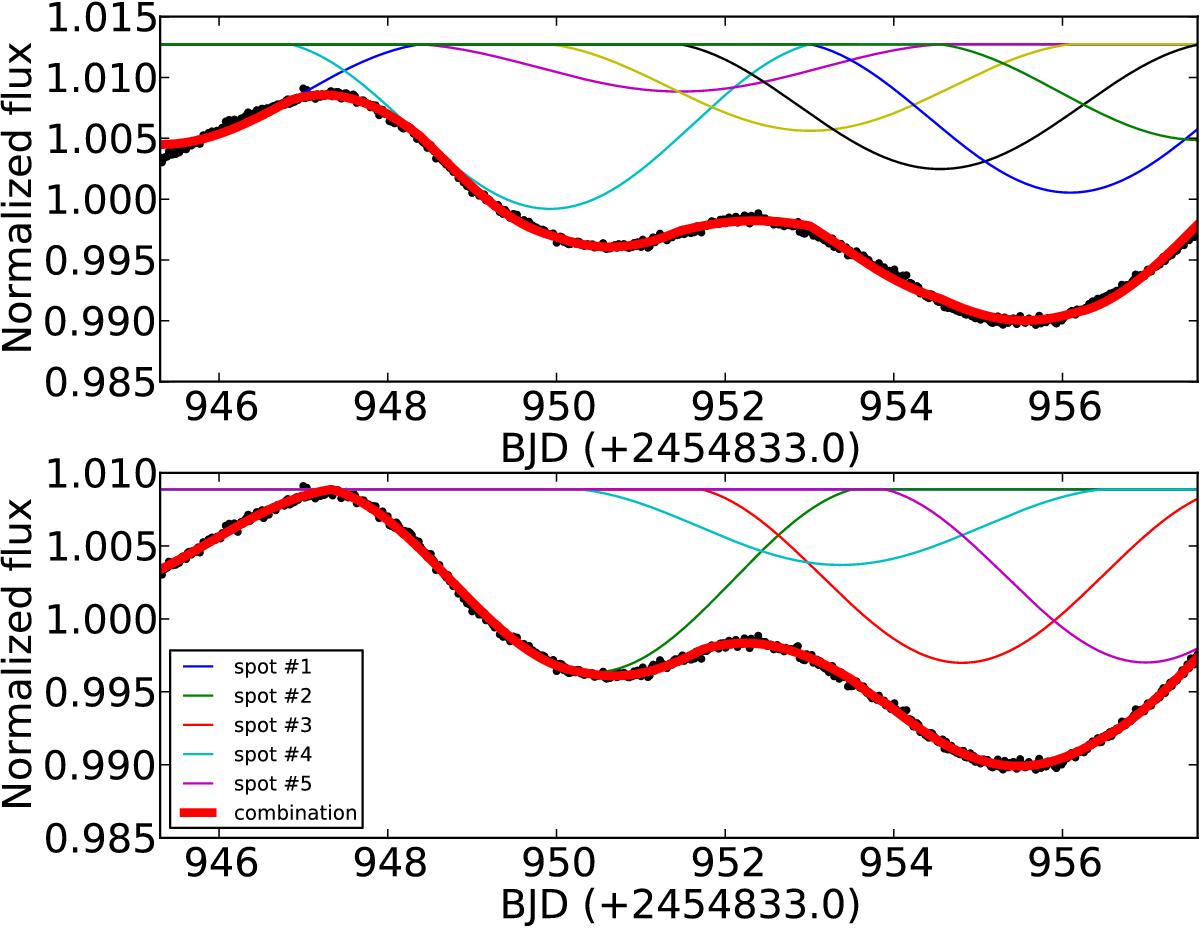
Top: visual representation of the 10 fixed spot model. Each of the thin colored lines represents the flux reduction caused from each of the spots during a full rotation. The combined flux reduction is given from the aggregation of the five spots models (thick red line). Bottom: as for top panel, but for the five-spot model.
Current usage metrics show cumulative count of Article Views (full-text article views including HTML views, PDF and ePub downloads, according to the available data) and Abstracts Views on Vision4Press platform.
Data correspond to usage on the plateform after 2015. The current usage metrics is available 48-96 hours after online publication and is updated daily on week days.
Initial download of the metrics may take a while.