Fig. 9
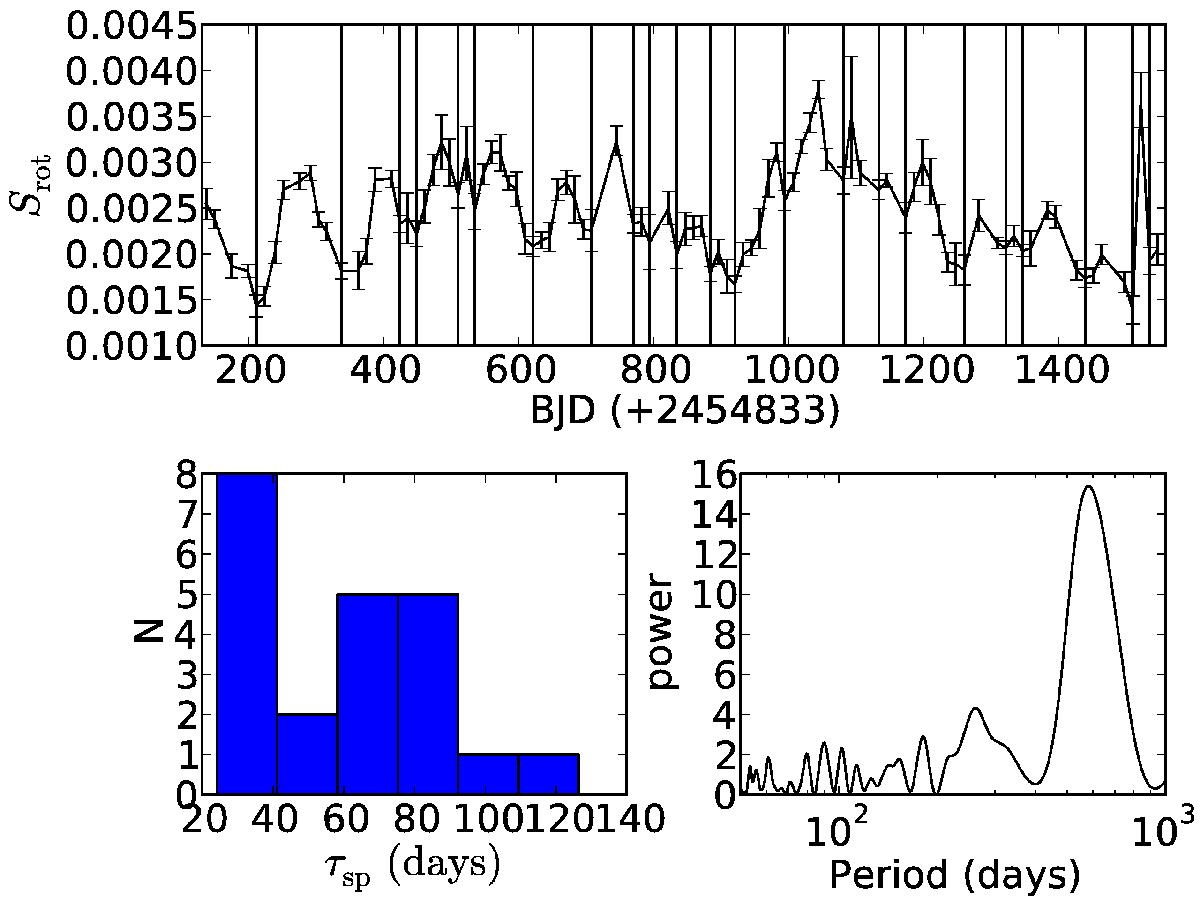
Top: evolution of the size of the total spotted area, calculated as the summed area of the spots, which define the model for each light curve chunk. The vertical lines indicate the local minima of the curve. Bottom-left: distribution of the spot life times (see text for details). Bottom-right: L-S periodogram for the evolution of the spotted area size.
Current usage metrics show cumulative count of Article Views (full-text article views including HTML views, PDF and ePub downloads, according to the available data) and Abstracts Views on Vision4Press platform.
Data correspond to usage on the plateform after 2015. The current usage metrics is available 48-96 hours after online publication and is updated daily on week days.
Initial download of the metrics may take a while.