Fig. 1
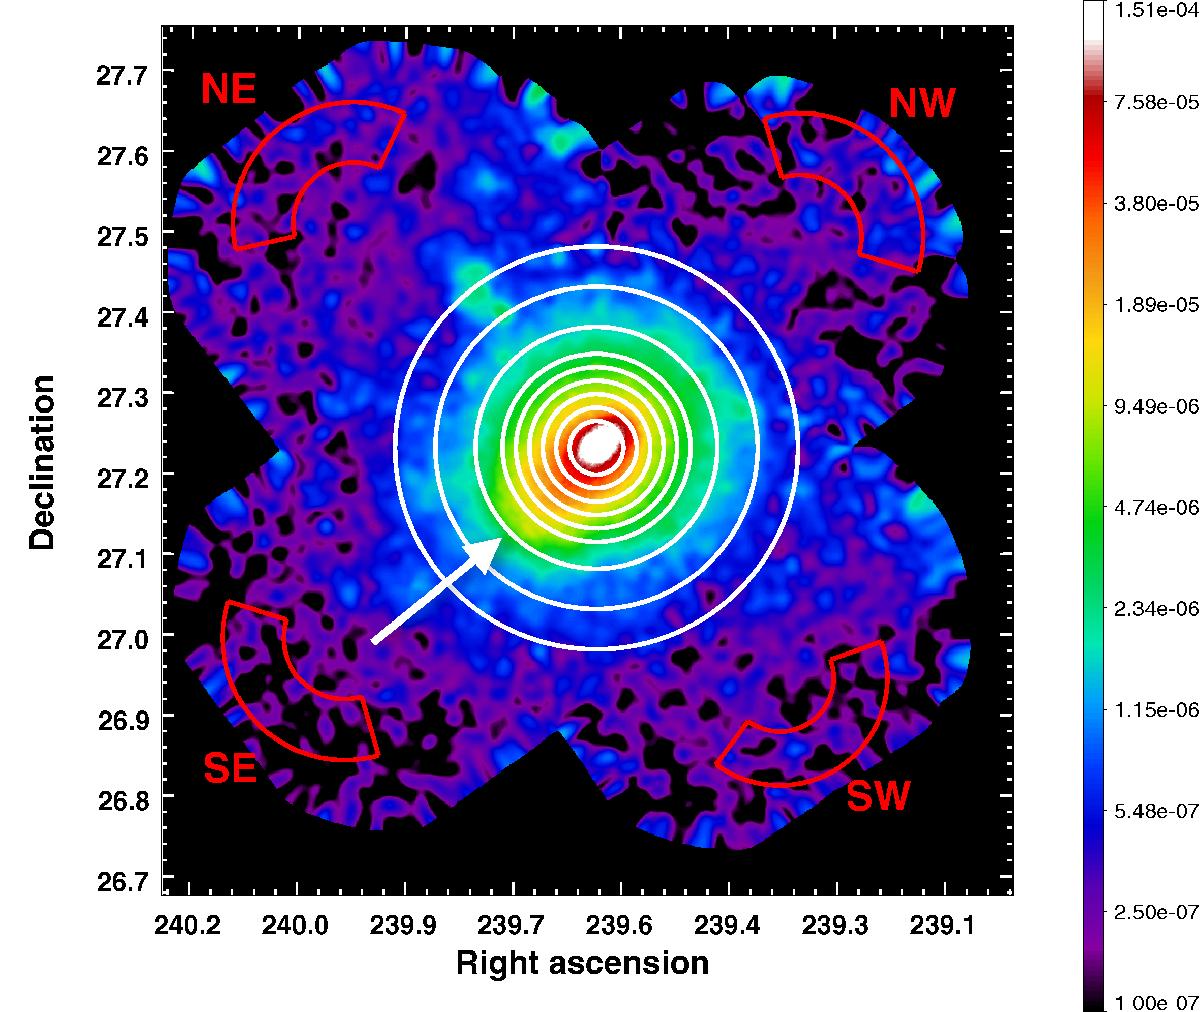
Combined XMM-Newton mosaic in the energy band [0.7−1.2] keV corrected for the different exposure times and for the NXB. The units in the color bar are MOS count/s. The concentric white circles show the regions chosen for the source spectral extraction. The outermost circle has a radius of 15 arcmin (corresponding to ~1530 kpc). The four regions delimited by the red curves were used to estimate the local sky background components. The labels represent the four regions used in the analysis: the northeast (NE), northwest (NW), southeast (SE), and southwest (SW) observations. The white arrow indicates the location of the outermost cold front (Rossetti et al. 2013, see Sect. 5.1.3). The tip of the accreting substructure observed in the region NE, as reported in Eckert et al. (2014), is located at approximatively (RA = 239.72°, Dec = 27.40°).
Current usage metrics show cumulative count of Article Views (full-text article views including HTML views, PDF and ePub downloads, according to the available data) and Abstracts Views on Vision4Press platform.
Data correspond to usage on the plateform after 2015. The current usage metrics is available 48-96 hours after online publication and is updated daily on week days.
Initial download of the metrics may take a while.