Fig. 15
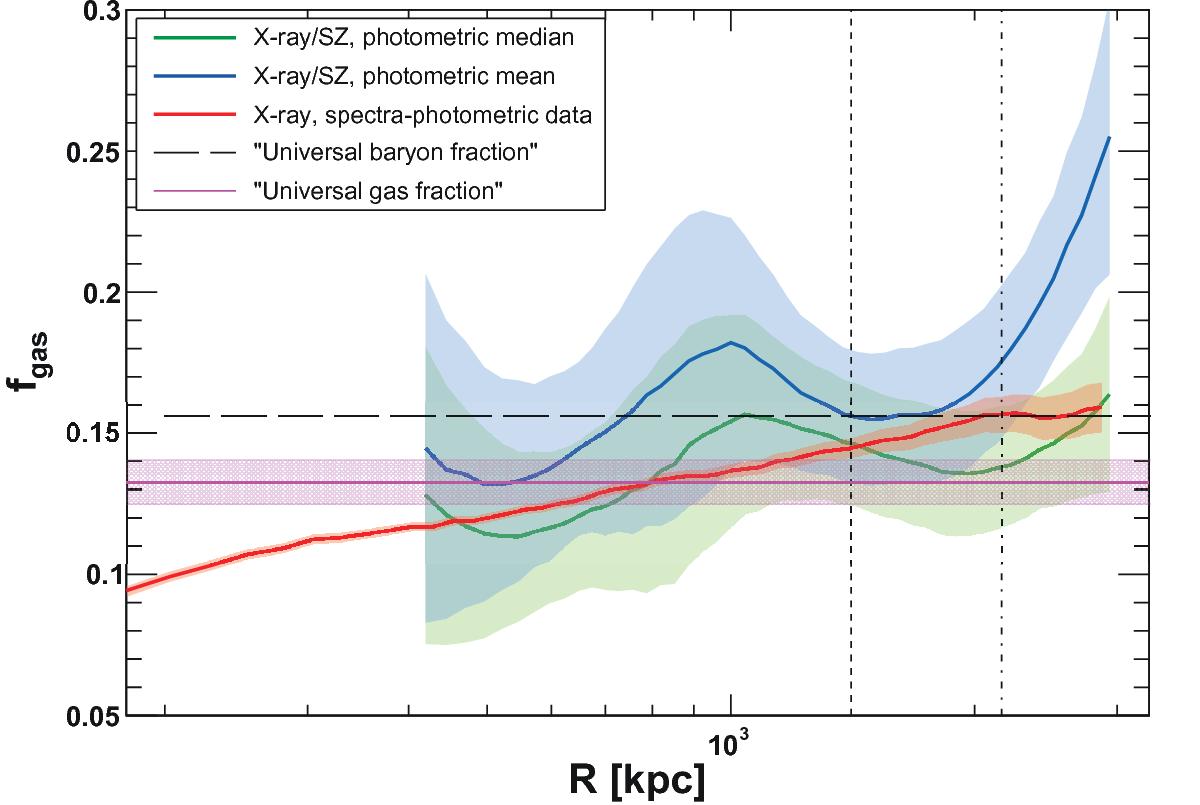
Gas fraction profile. Green: X-SZ combined profile using the azimuthal median density profile. Blue: X-SZ combined profile using the azimuthal mean density profile. Red: NFW fit to the spectroscopic X-ray data using the method of Ettori et al. (2010). The dashed and dash-dotted vertical lines represent R500 and R200, respectively. The dashed horizontal line represents the universal baryon fraction from Planck (Planck Collaboration XIII 2016), whereas the criss-crossed area shows the expected gas fraction corrected for the fraction of baryons in the form of stars (Gonzalez et al. 2007).
Current usage metrics show cumulative count of Article Views (full-text article views including HTML views, PDF and ePub downloads, according to the available data) and Abstracts Views on Vision4Press platform.
Data correspond to usage on the plateform after 2015. The current usage metrics is available 48-96 hours after online publication and is updated daily on week days.
Initial download of the metrics may take a while.