Fig. B.1
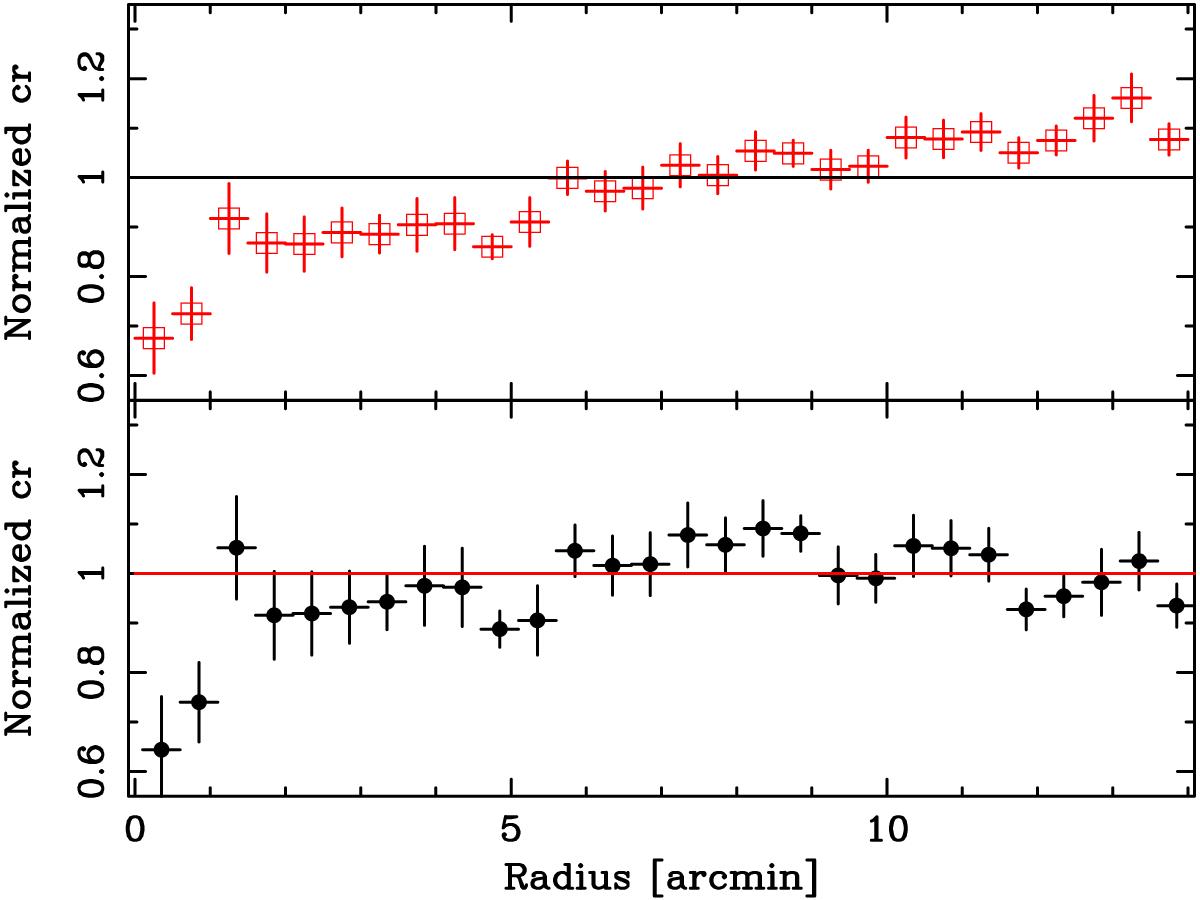
Stacked normalized EPIC surface-brightness profile for 21 blank fields (see Table A.1). Top panel: profile produced without accounting for the QSP component. The surface brightness increases steadily moving from the center to outer regions of the detectors. Bottom panel: profile produced after subtraction of the QSP component. Beyond the innermost arcminute, the profile is flat, within deviations contained within 5%−10%.
Current usage metrics show cumulative count of Article Views (full-text article views including HTML views, PDF and ePub downloads, according to the available data) and Abstracts Views on Vision4Press platform.
Data correspond to usage on the plateform after 2015. The current usage metrics is available 48-96 hours after online publication and is updated daily on week days.
Initial download of the metrics may take a while.