Fig. D.1
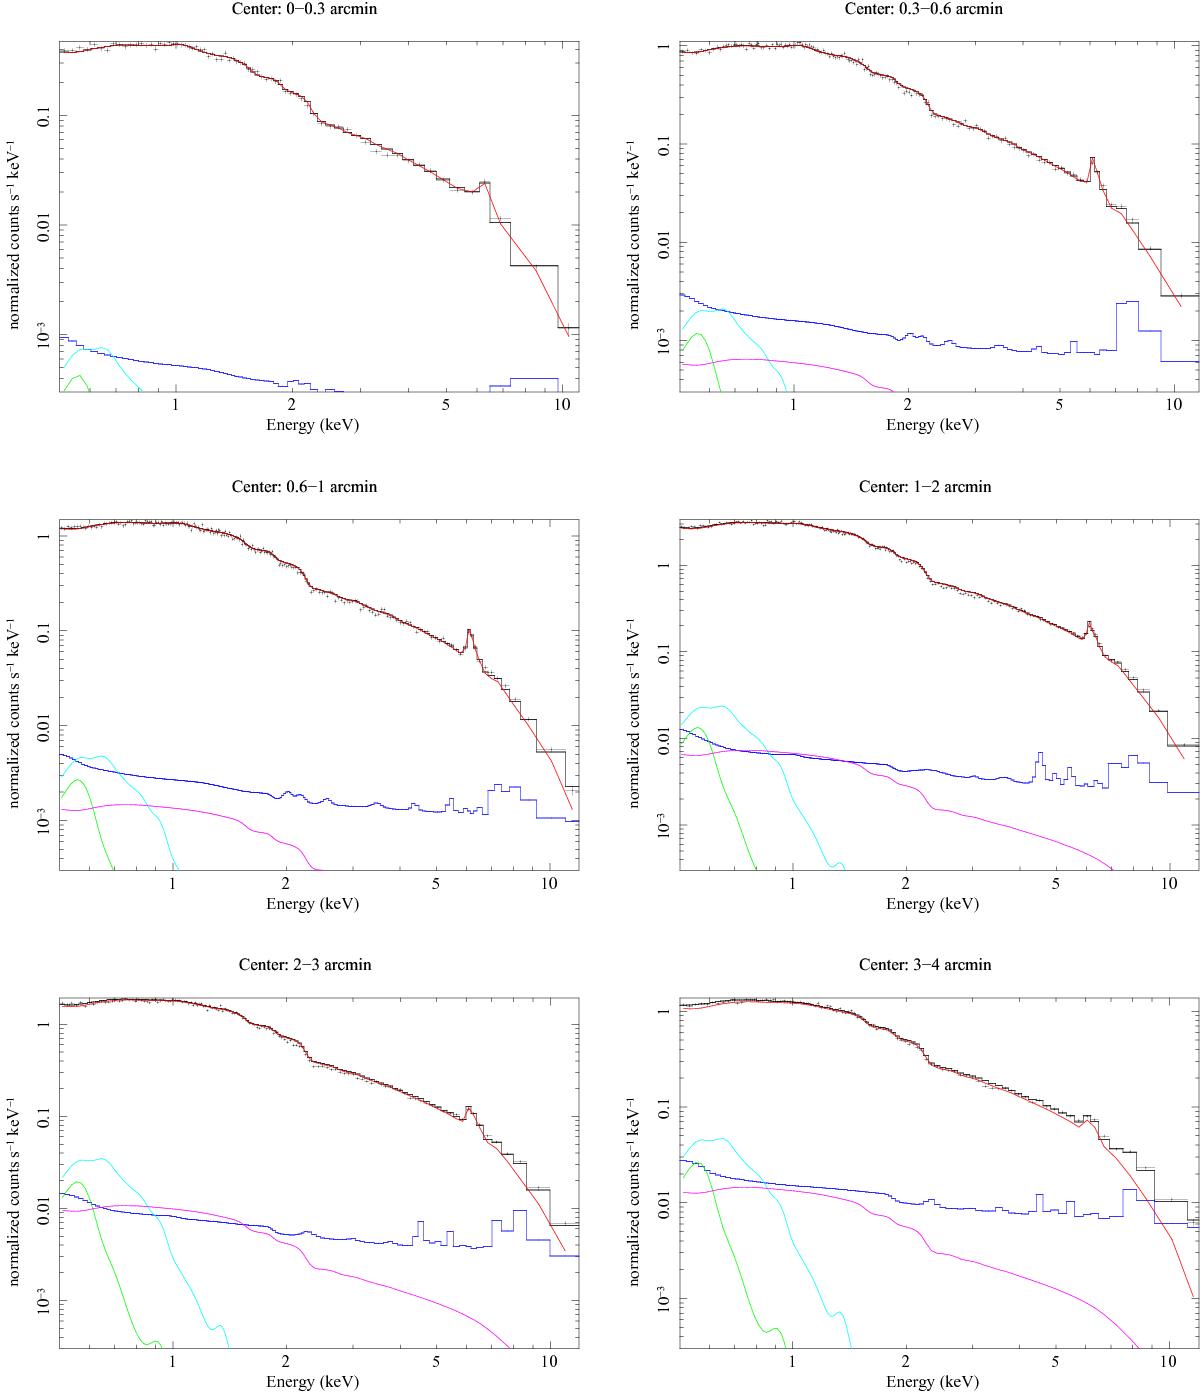
EPIC pn spectra for the annuli defined in Fig. 1. The various components used for the fit are shown in red for the source; in blue for the NXB; in magenta for the CXB; in cyan for the Galactic halo emission; and in green for the local hot bubble. The fit was performed jointly on all 3 EPIC instruments, but here only the pn is shown for clarity. The results of the fit are listed in Table 3.
Current usage metrics show cumulative count of Article Views (full-text article views including HTML views, PDF and ePub downloads, according to the available data) and Abstracts Views on Vision4Press platform.
Data correspond to usage on the plateform after 2015. The current usage metrics is available 48-96 hours after online publication and is updated daily on week days.
Initial download of the metrics may take a while.