Free Access
Fig. D.2
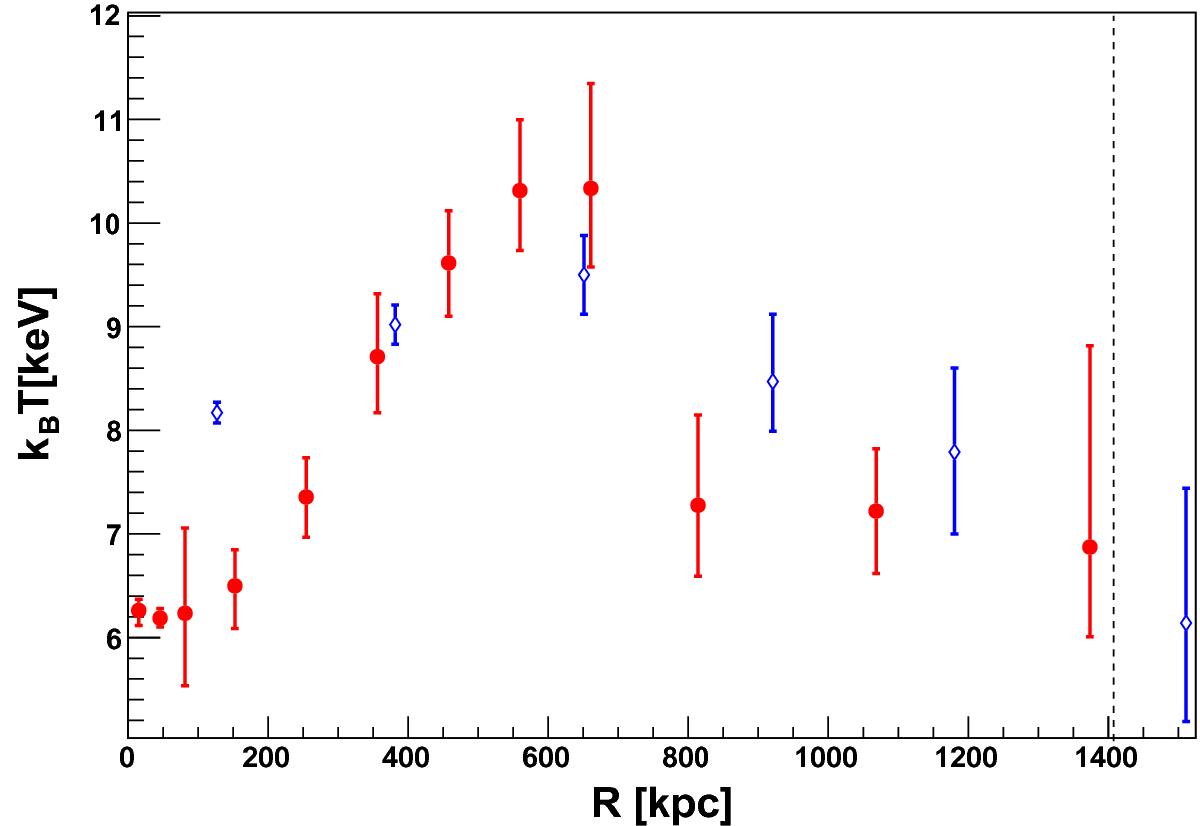
Temperature profile in the NW direction. Red: data points using the APEC model on XMM-Newton observations. In blue: data point from Akamatsu et al. (2011) obtained with Suzaku. The dashed line represents the value of R500.
Current usage metrics show cumulative count of Article Views (full-text article views including HTML views, PDF and ePub downloads, according to the available data) and Abstracts Views on Vision4Press platform.
Data correspond to usage on the plateform after 2015. The current usage metrics is available 48-96 hours after online publication and is updated daily on week days.
Initial download of the metrics may take a while.