Fig. 5
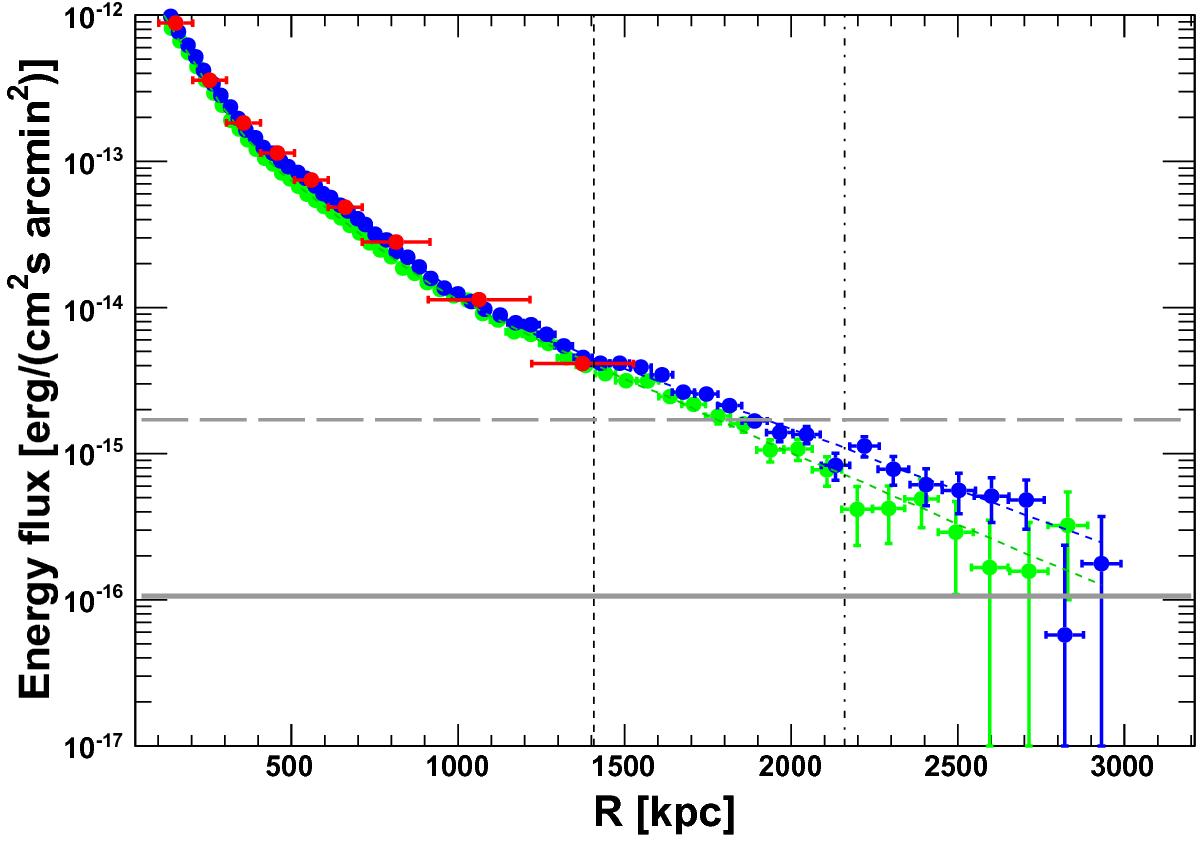
Surface-brightness profiles of A 2142 obtained with different methods. The data points show the spectroscopic measurements (red), the azimuthally averaged profile (blue), and the azimuthal median (green). The green and blue thin dashed lines show the corresponding best fits obtained with the multiscale deprojection method. The solid and dashed horizontal lines correspond to the total background level and to the uncertainty on the background, respectively. The dashed and dash-dotted vertical lines represent R500 and R200, respectively.
Current usage metrics show cumulative count of Article Views (full-text article views including HTML views, PDF and ePub downloads, according to the available data) and Abstracts Views on Vision4Press platform.
Data correspond to usage on the plateform after 2015. The current usage metrics is available 48-96 hours after online publication and is updated daily on week days.
Initial download of the metrics may take a while.