Fig. 6
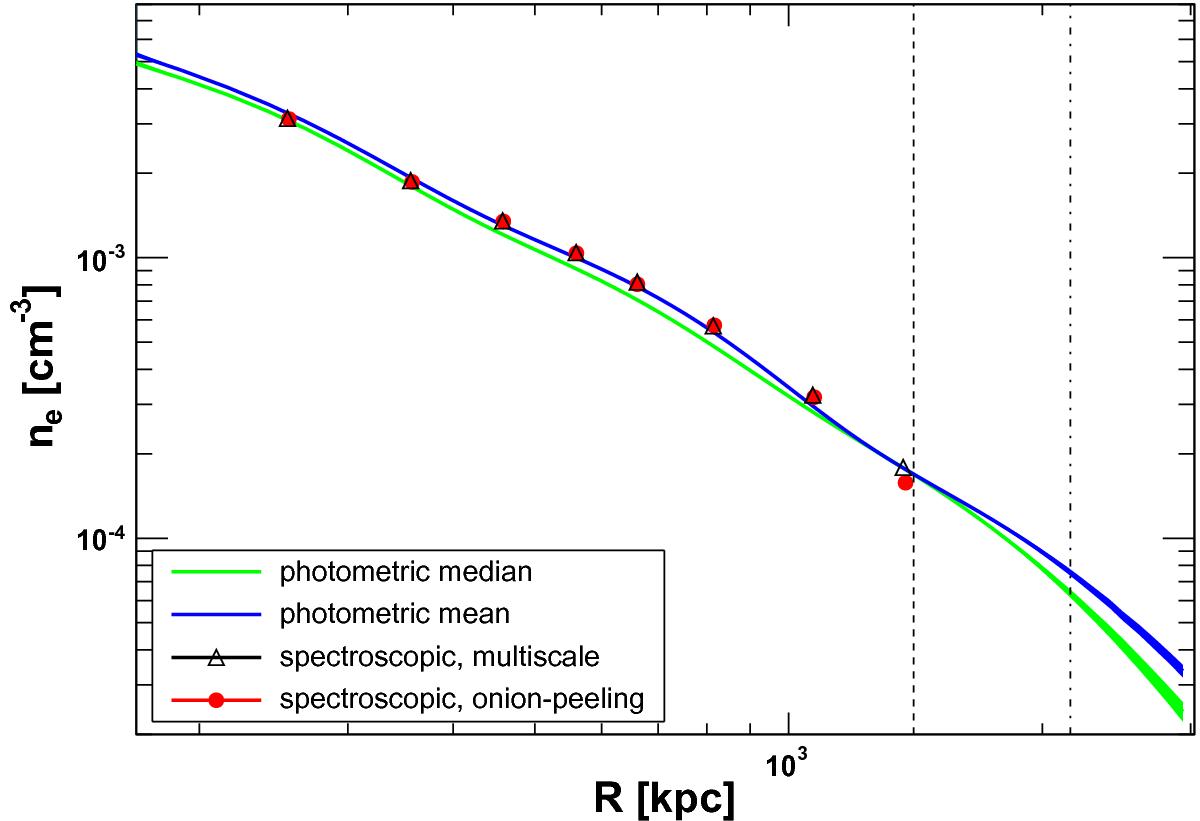
Electron density profile. The data points show the deprojected spectroscopic data (from Table 3) using the multiscale method (black triangle; Eckert et al. 2016) and the onion peeling method (red dot; Ettori et al. 2010). The green and blue data curves show the density profiles recovered using the azimuthal median and azimuthal mean photometric surface-brightness profiles, respectively. Both profiles were deprojected using the multiscale method. The dashed and dash-dotted vertical lines represent R500 and R200, respectively.
Current usage metrics show cumulative count of Article Views (full-text article views including HTML views, PDF and ePub downloads, according to the available data) and Abstracts Views on Vision4Press platform.
Data correspond to usage on the plateform after 2015. The current usage metrics is available 48-96 hours after online publication and is updated daily on week days.
Initial download of the metrics may take a while.