Fig. 7
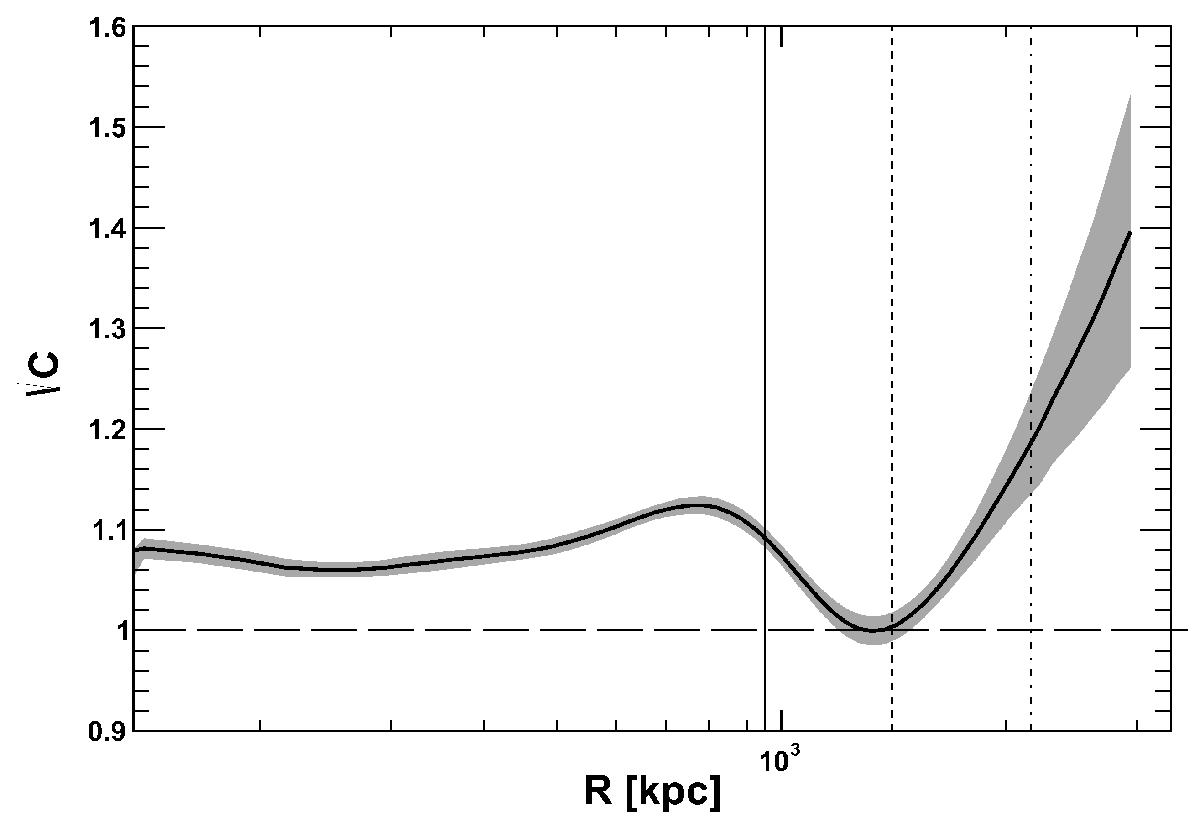
Clumping factor profile. Solid line: median of the MCMC simulation; shaded area: 68% confidence interval around the median. The dashed and dash-dotted vertical lines represent R500 and R200, respectively. The triple dot-dashed line shows the approximative position of maximal radius of the sloshing region reported in Rossetti et al. (2013).
Current usage metrics show cumulative count of Article Views (full-text article views including HTML views, PDF and ePub downloads, according to the available data) and Abstracts Views on Vision4Press platform.
Data correspond to usage on the plateform after 2015. The current usage metrics is available 48-96 hours after online publication and is updated daily on week days.
Initial download of the metrics may take a while.