Fig. 9
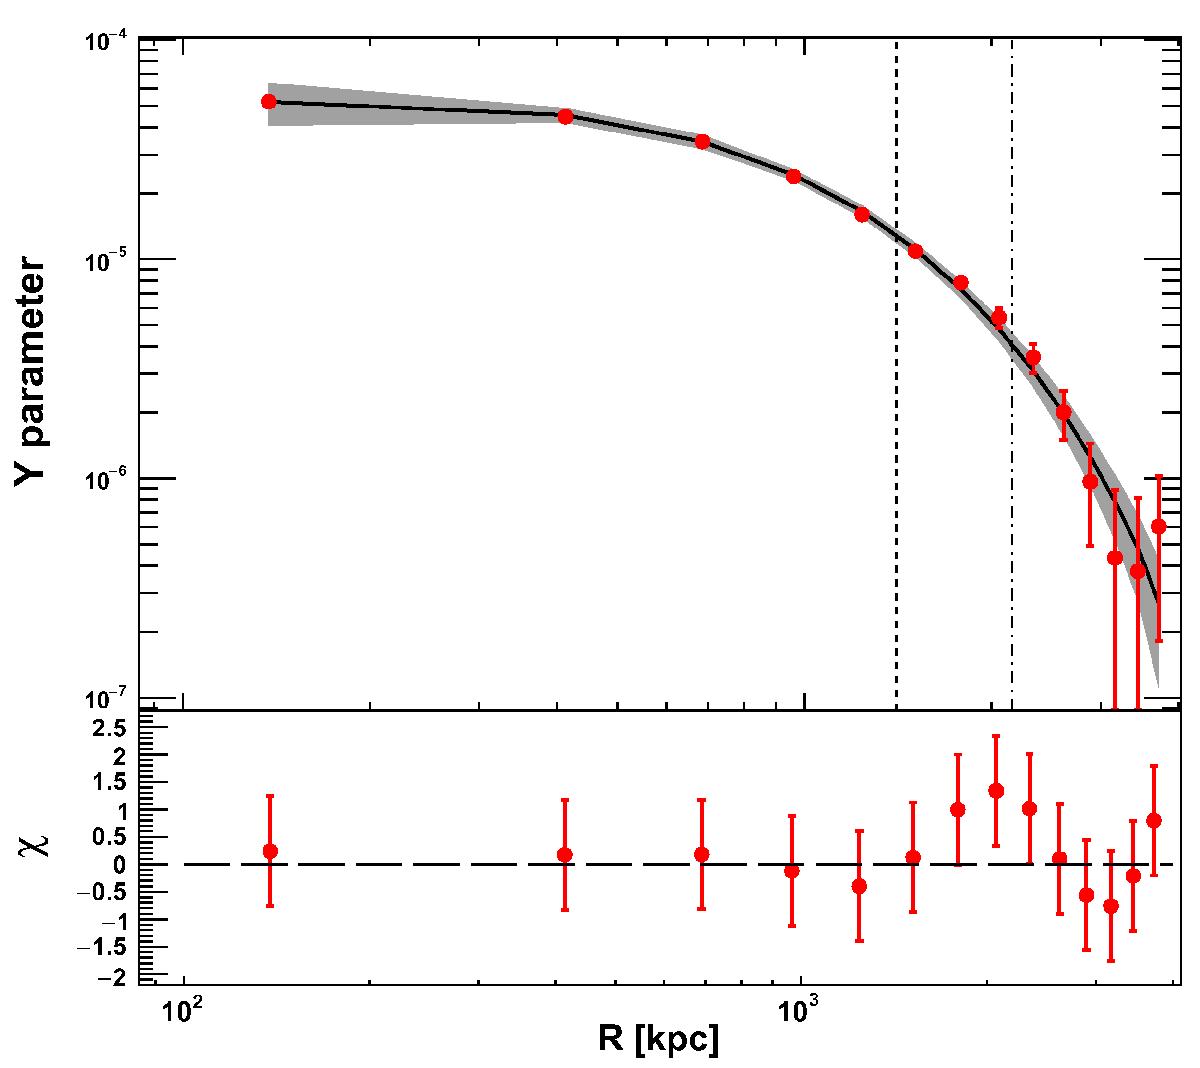
Top panel: compton-y parameter profile from Planck data (red points). The gray solid line and shaded area show the best-fit profile convolved with the instrument PSF. The data points are correlated and the associated errors correspond to the square root of the diagonal elements of the covariance matrix. Bottom panel: residual of the fit to the Planck data. The dashed and dash-dotted vertical lines represent R500 and R200, respectively.
Current usage metrics show cumulative count of Article Views (full-text article views including HTML views, PDF and ePub downloads, according to the available data) and Abstracts Views on Vision4Press platform.
Data correspond to usage on the plateform after 2015. The current usage metrics is available 48-96 hours after online publication and is updated daily on week days.
Initial download of the metrics may take a while.