Free Access
Fig. 2
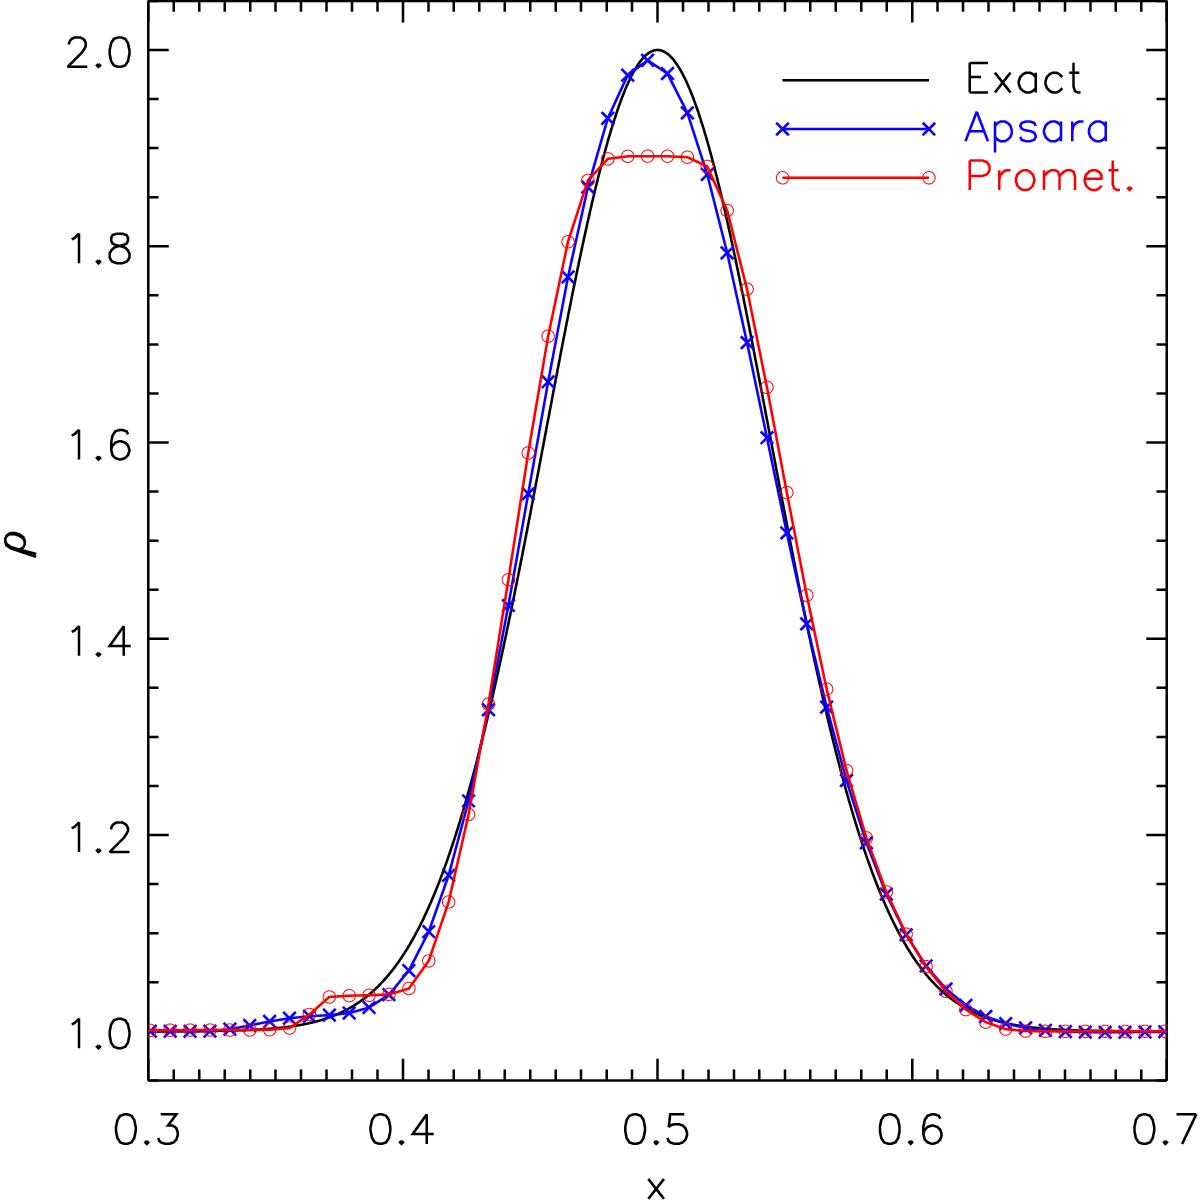
Density profiles for the 1D linear advection test obtained on a grid of 128 zones at t = 10. Results computed with Apsara and Prometheus are shown with blue crosses and red circles, respectively. The exact solution is shown in black.
Current usage metrics show cumulative count of Article Views (full-text article views including HTML views, PDF and ePub downloads, according to the available data) and Abstracts Views on Vision4Press platform.
Data correspond to usage on the plateform after 2015. The current usage metrics is available 48-96 hours after online publication and is updated daily on week days.
Initial download of the metrics may take a while.