Fig. 1
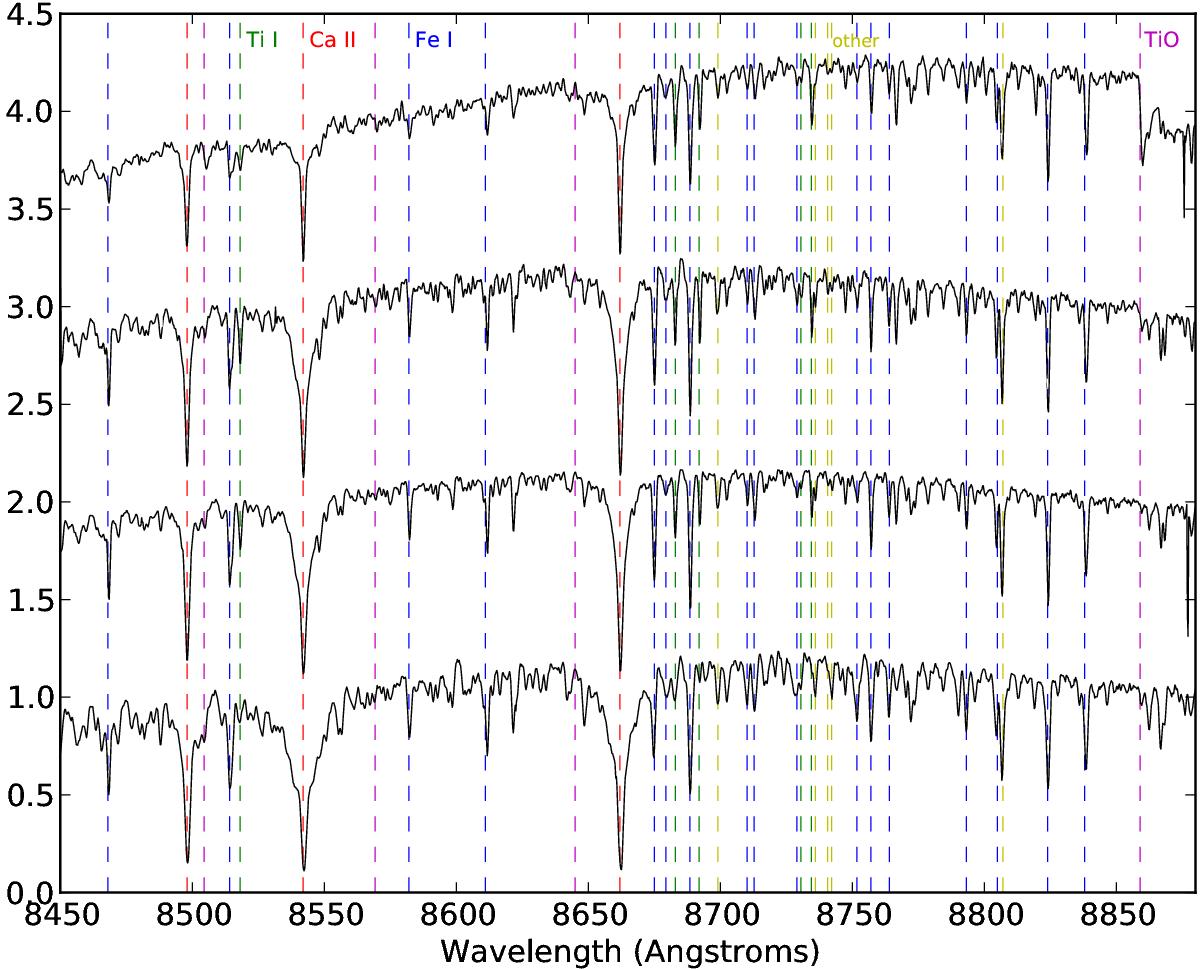
Example of the spectra used. This is a SpT sequence displaying all the features measured. The stars shown have about the same luminosity class and similar metallicity (they are all from the LMC). From bottom to top: [M2002]169754 (G5Ia), [M2002]168047 (K4Iab), [M2002]130426 (M2Iab), and [M2002]130426 (M5Iab). The dashed lines indicate the spectral features measured (shortened list, see text). Their colour represents the dominant chemical species in each feature: red for Ca ii, blue for Fe i, green for Ti i, yellow for other atomic lines (Mn i, Si i and Mg i), and magenta for the TiO bands. For more details, see Sect. 2.
Current usage metrics show cumulative count of Article Views (full-text article views including HTML views, PDF and ePub downloads, according to the available data) and Abstracts Views on Vision4Press platform.
Data correspond to usage on the plateform after 2015. The current usage metrics is available 48-96 hours after online publication and is updated daily on week days.
Initial download of the metrics may take a while.