Fig. 10
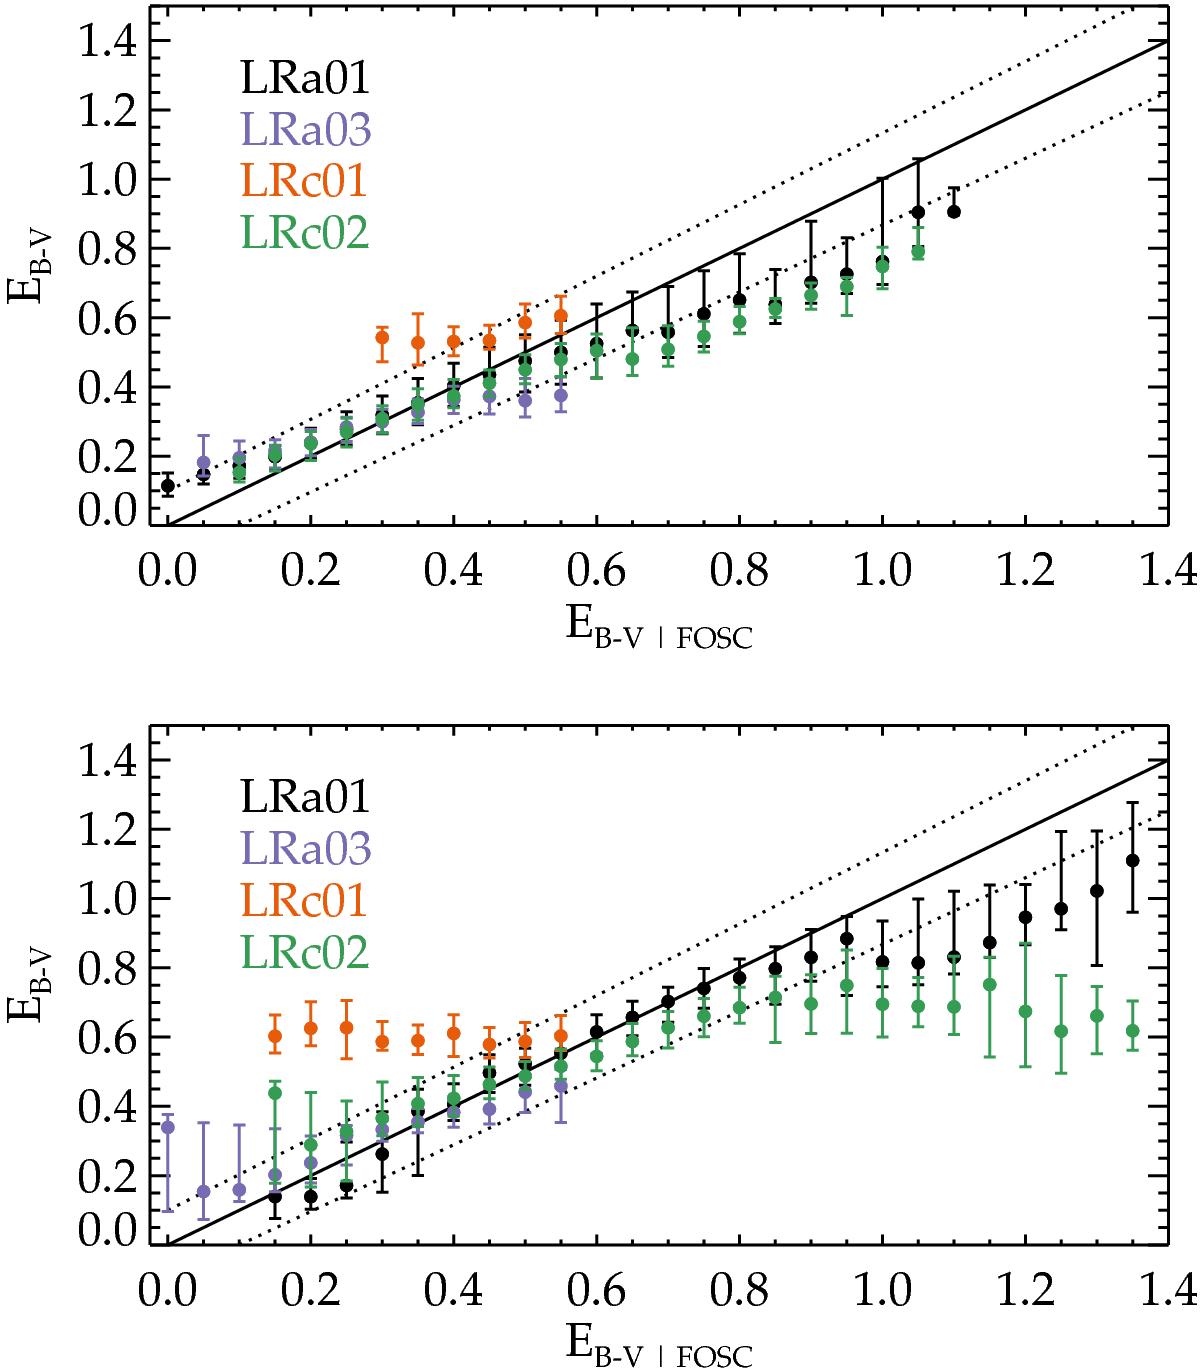
Median values of EB−V used to produce the synthetic catalogues vs. that found with the FOSC for dwarfs (top) and giants (bottom). The error bars give the value of the first and third quartile of the distribution for each bin. The solid black line materialised perfect correlation and the dotted lines show the ± 10% interval around it. The colours of the symbols correspond to the different runs, as indicated. The synthetic magnitudes reproduce the characteristics of the Obscat catalogue.
Current usage metrics show cumulative count of Article Views (full-text article views including HTML views, PDF and ePub downloads, according to the available data) and Abstracts Views on Vision4Press platform.
Data correspond to usage on the plateform after 2015. The current usage metrics is available 48-96 hours after online publication and is updated daily on week days.
Initial download of the metrics may take a while.