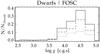
Fig. 12
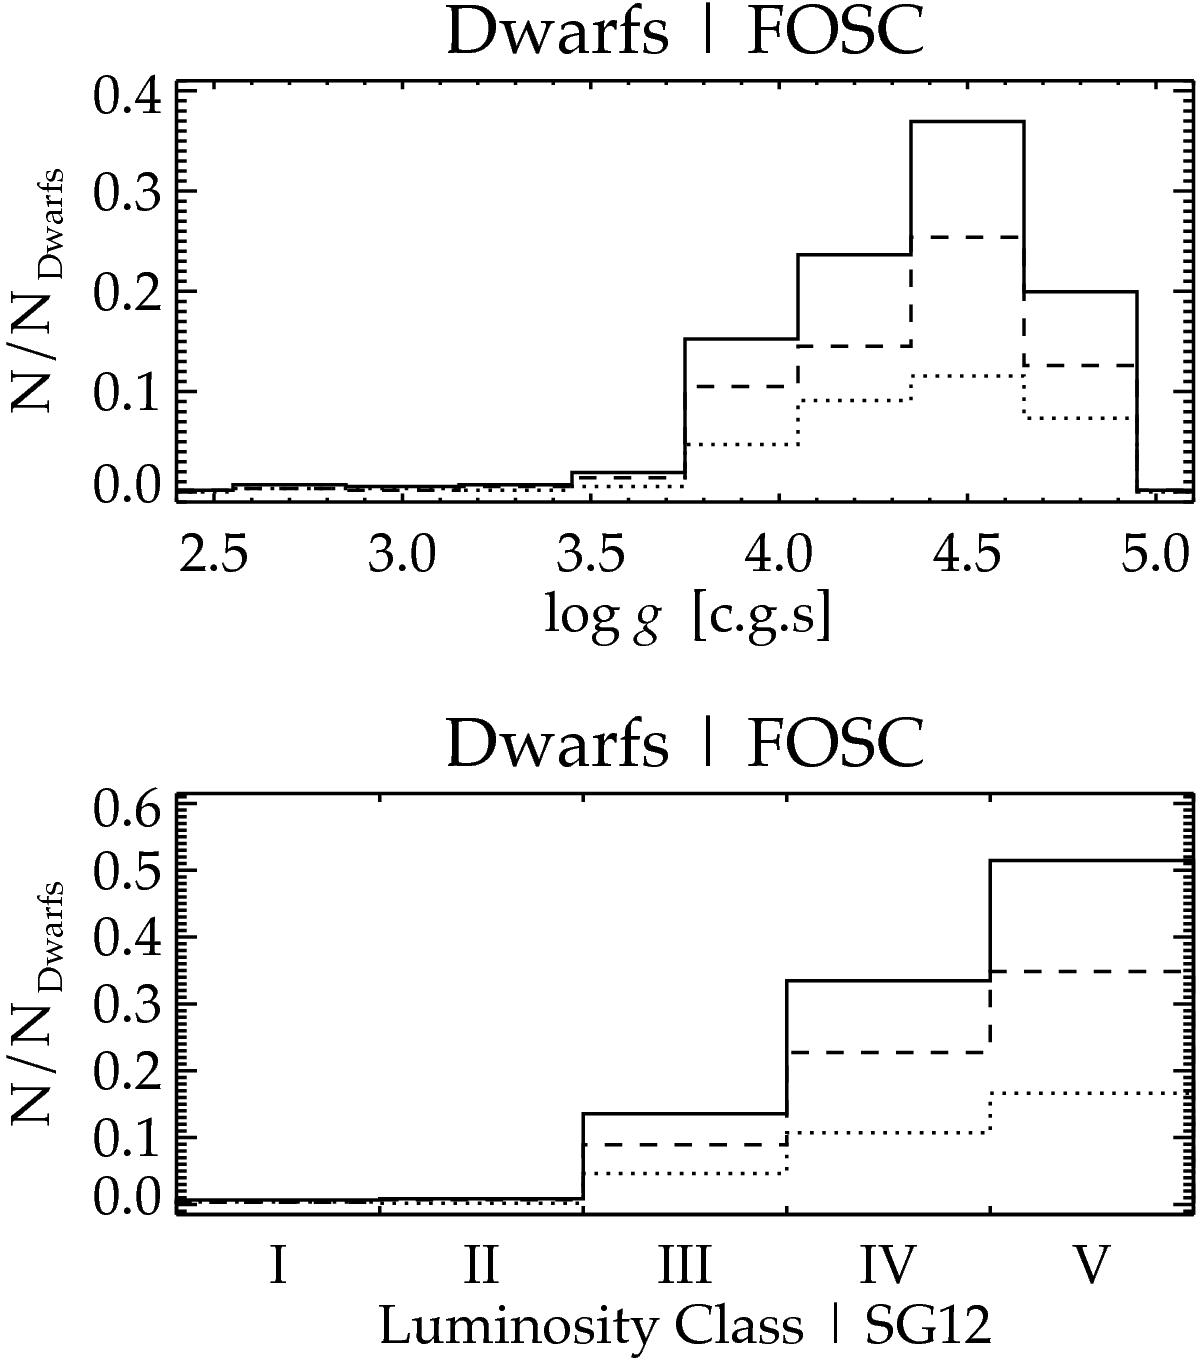
Distribution of indicators of the luminosity class found by other authors for stars classified as dwarfs by the FOSC. Top: distribution of log g found by Ga10. Bottom: distribution of luminosity classes found by SG12. The solid lines show the relative frequency of the log g value (luminosity class, respectively, for the bottom panel) in the whole sample stars classified as dwarfs by the FOSC. The contribution from stars in the sample that have the luminosity class V with the FOSC is shown by the dashed line, and the contribution of those of luminosity class IV is indicated by the dotted line. The dotted and dashed curves add up to the solid curve.
Current usage metrics show cumulative count of Article Views (full-text article views including HTML views, PDF and ePub downloads, according to the available data) and Abstracts Views on Vision4Press platform.
Data correspond to usage on the plateform after 2015. The current usage metrics is available 48-96 hours after online publication and is updated daily on week days.
Initial download of the metrics may take a while.