Fig. 19
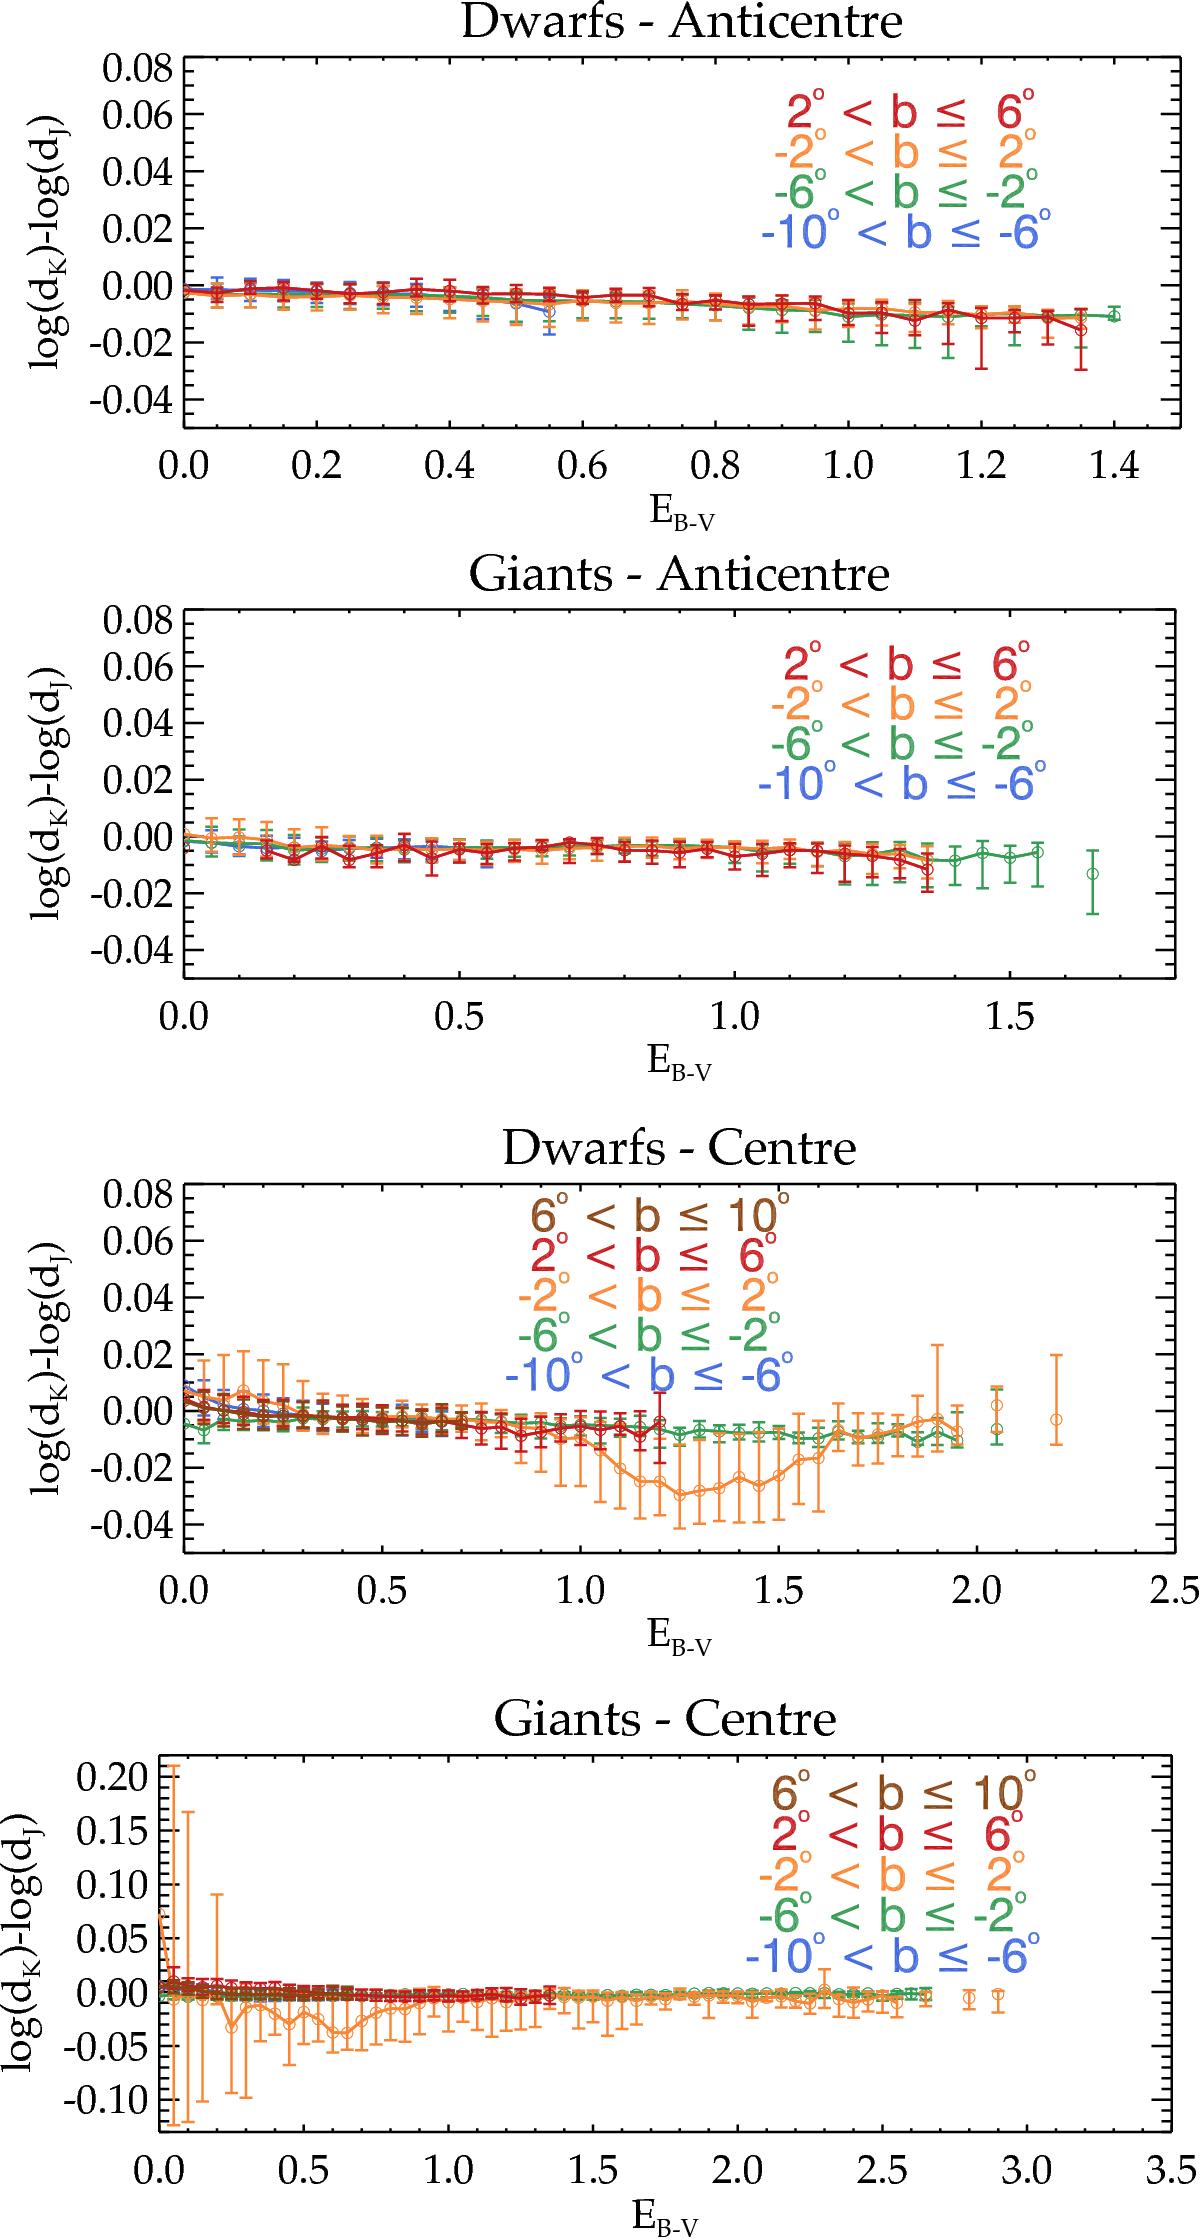
Median values of the difference between the distance dK and dJ using the Ks band and J -band, respectively; these values are computed for bins of EB−V, for different galactic latitudes b (in colour as indicated in the plots) in the anticentre fields (two top panels) and centre fields (two bottom panels), and for dwarfs and giants as indicated in the figure. The error bars give the value of the first and third quartile of the distribution for each bin.
Current usage metrics show cumulative count of Article Views (full-text article views including HTML views, PDF and ePub downloads, according to the available data) and Abstracts Views on Vision4Press platform.
Data correspond to usage on the plateform after 2015. The current usage metrics is available 48-96 hours after online publication and is updated daily on week days.
Initial download of the metrics may take a while.