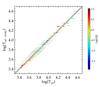
Fig. C.2
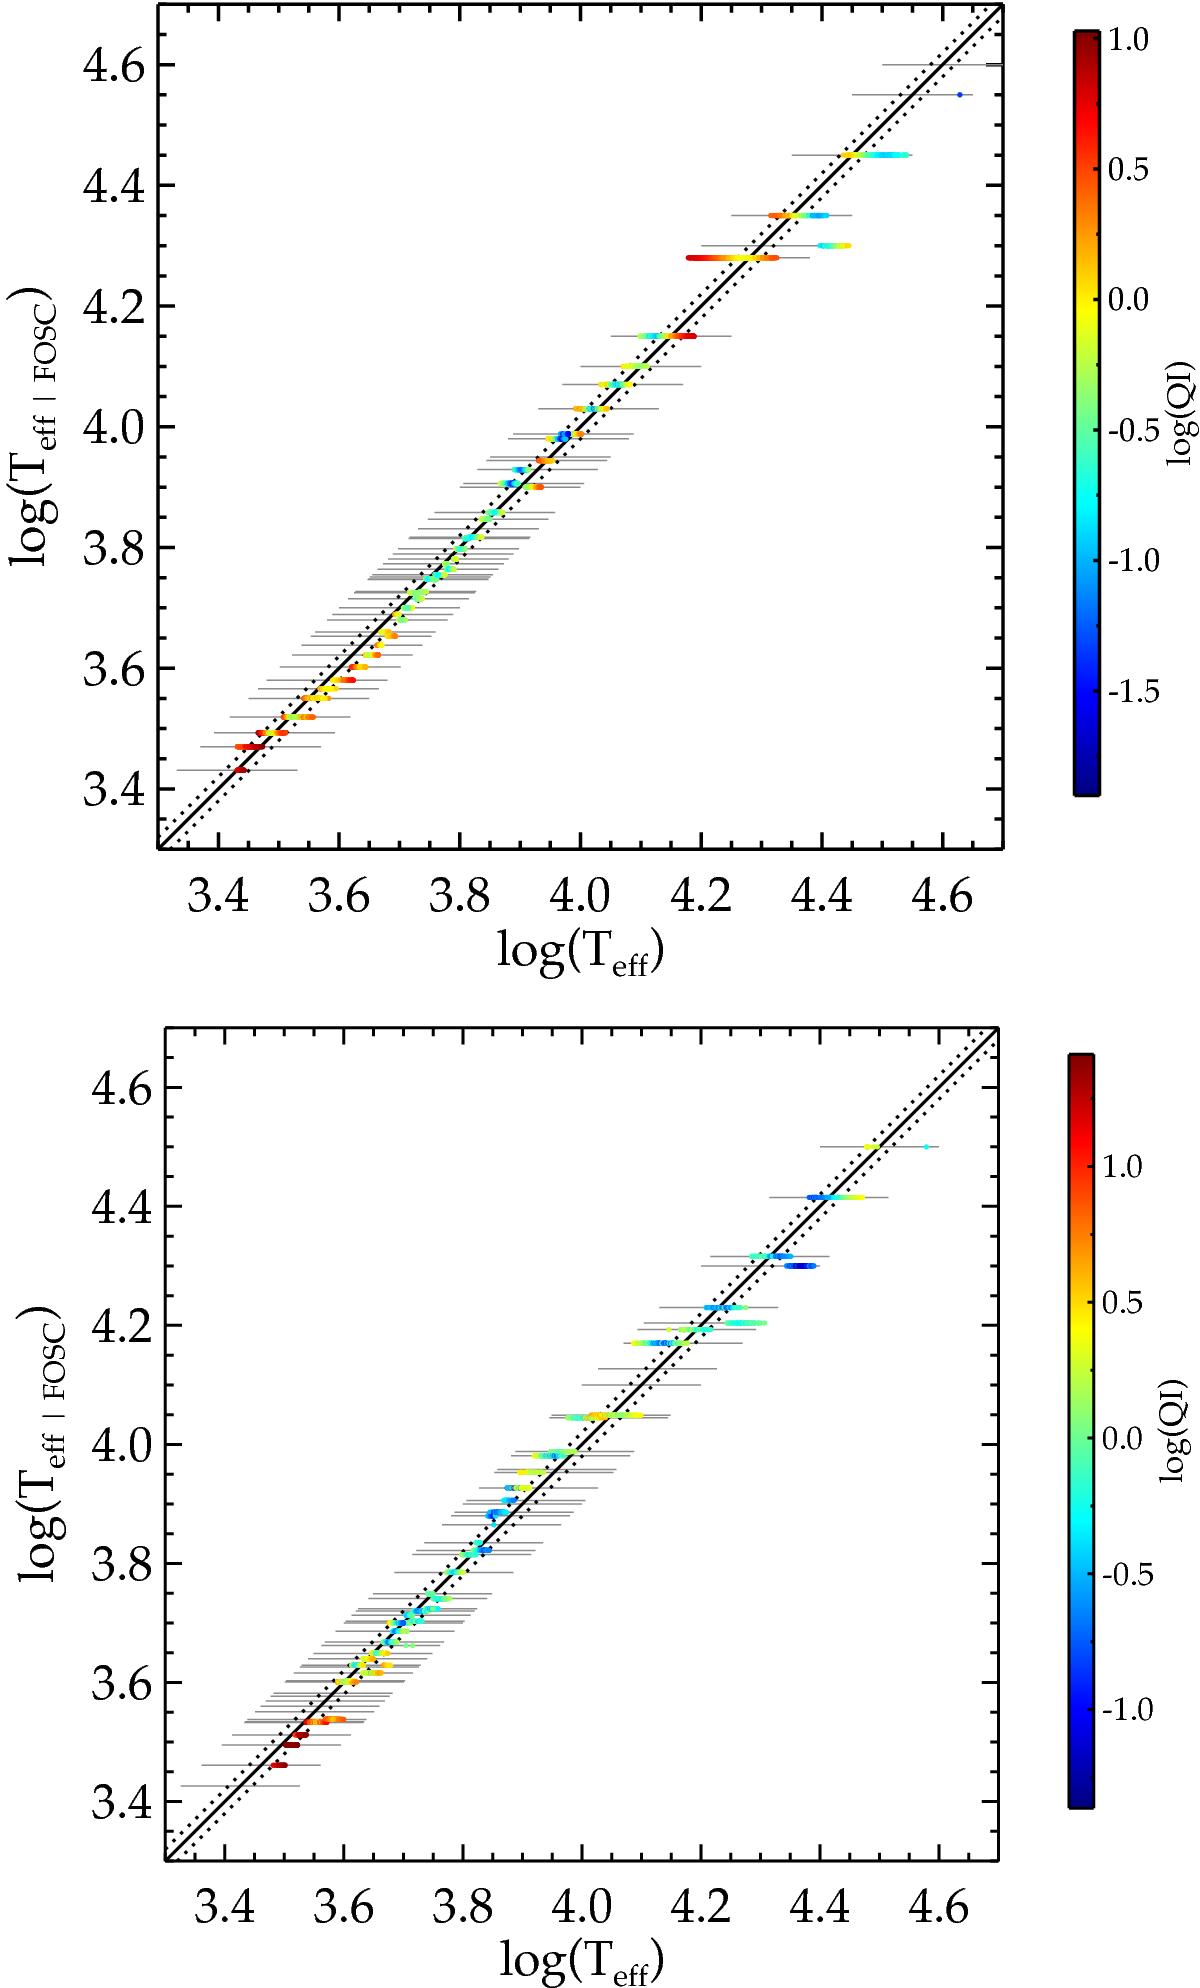
Logarithm of the effective temperature corresponding to the spectral class found by the FOSC as a function of the model effective temperature. Each symbol corresponds to a simulated star and their colour depends on the quality index QI (see Eq. (3)) as indicated by the colour scale on the right-hand side of the plot. The solid black line indicates the exact correlation and the dotted black lines shows the ± 5% band. The thin horizontal grey lines indicate the effective temperatures of the templates available in the Pickles library. Top: for the sample of “dwarfs” stars classified with luminosity classes IV and V. Bottom: for the sample of “giant” stars, luminosity classes I, II, and III.
Current usage metrics show cumulative count of Article Views (full-text article views including HTML views, PDF and ePub downloads, according to the available data) and Abstracts Views on Vision4Press platform.
Data correspond to usage on the plateform after 2015. The current usage metrics is available 48-96 hours after online publication and is updated daily on week days.
Initial download of the metrics may take a while.