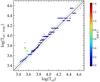
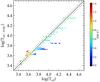
Fig. C.5
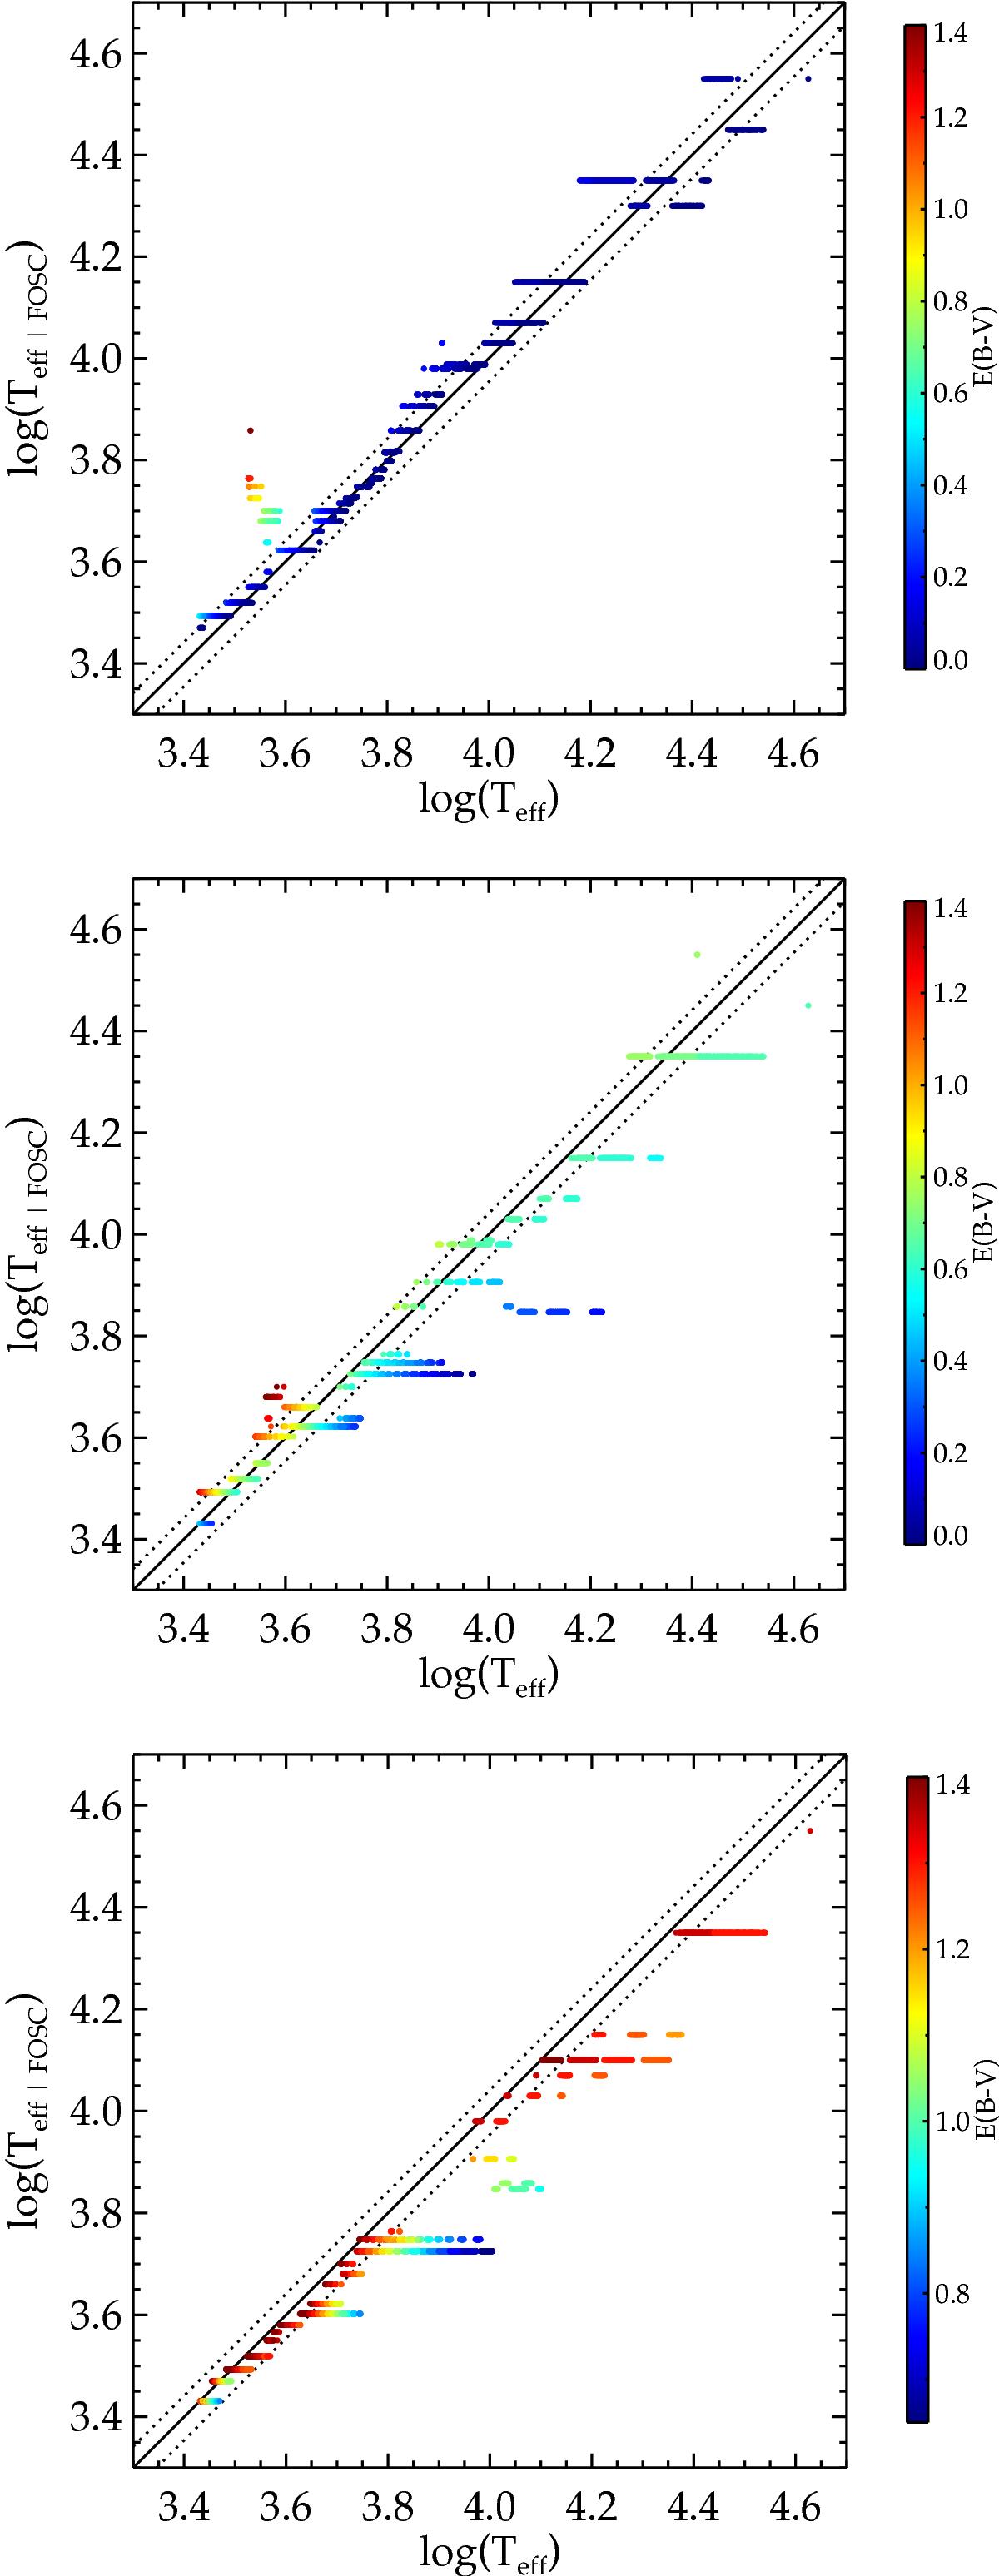
Logarithm of the effective temperature found by the FOSC as a function of the known effective temperature of the synthetic star for dwarfs when letting the minimisation be performed on the interval 0 ≤ EB−V ≤ 1.4. The colour of the points depends on the value of EB−V determined by the FOSC, as indicated by the colour scale on the right-hand side of the plots. The solid black line is the exact correlation and the dotted black lines show the ± 10% relative effective temperature band. Left: simulated magnitudes all have EB−V = 0. Middle: simulated magnitudes all have EB−V = 0.7. Right: simulated magnitudes all have EB−V = 1.4.
Current usage metrics show cumulative count of Article Views (full-text article views including HTML views, PDF and ePub downloads, according to the available data) and Abstracts Views on Vision4Press platform.
Data correspond to usage on the plateform after 2015. The current usage metrics is available 48-96 hours after online publication and is updated daily on week days.
Initial download of the metrics may take a while.