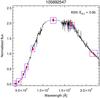
Fig. 3
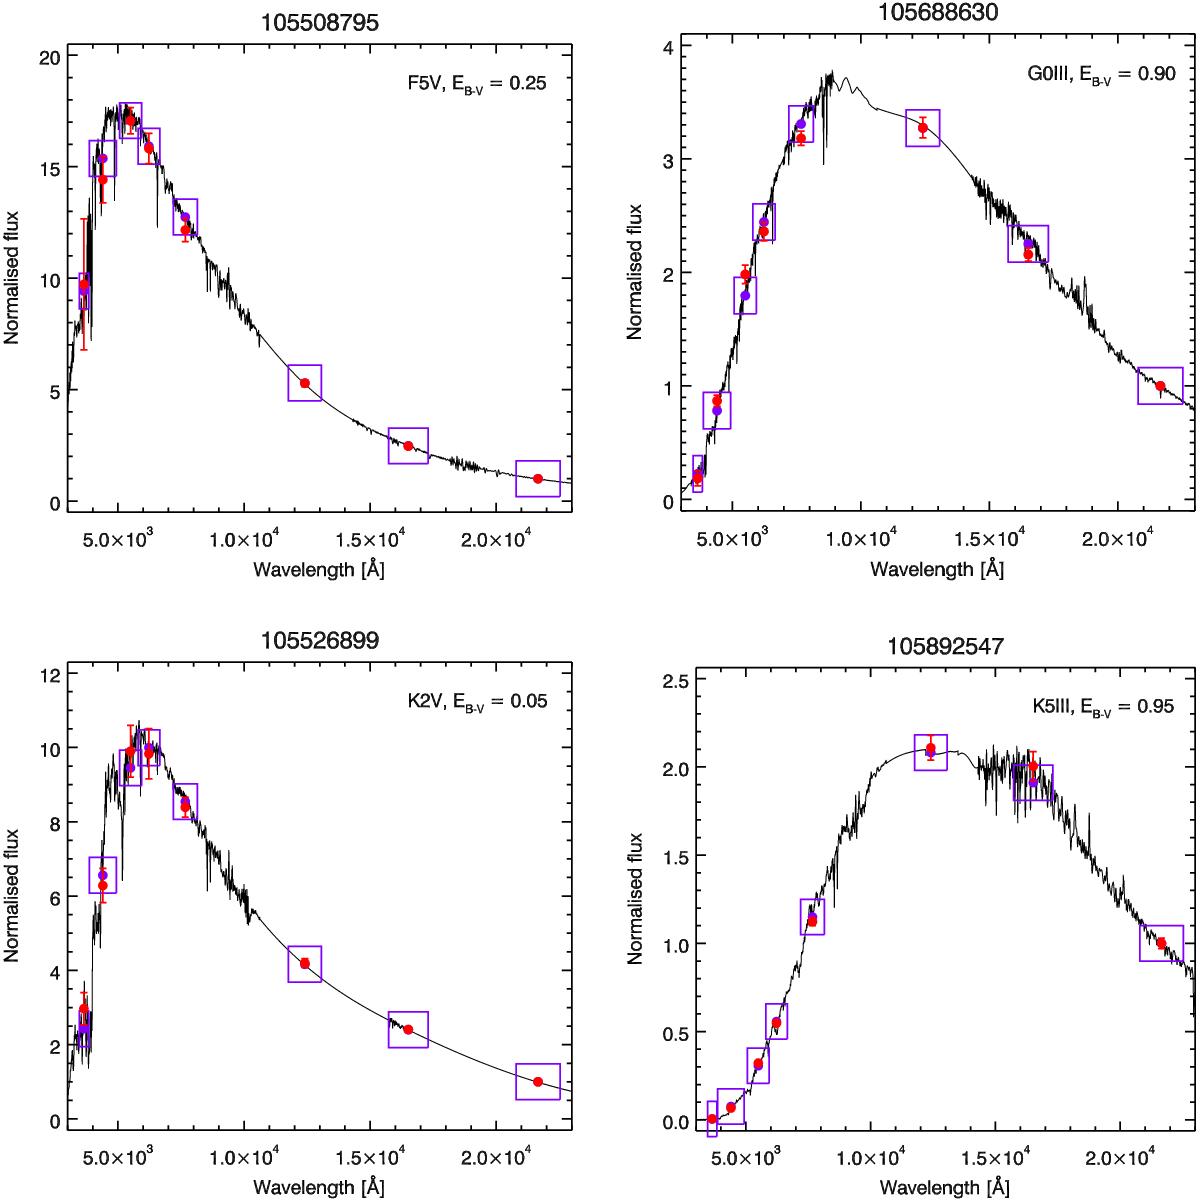
Spectral energy distribution of four CoRoT targets. The observed magnitudes are converted to fluxes and normalised to the band with the smallest photometric error (red dots with error bars). The FOSC returns the best matching pair of spectral type and EB−V in the library of templates. Their values are given in the top right corner of every plot, and the corresponding spectrum is over-plotted in solid black line. The match is obtained by computing the flux of the reddened templates convolved by the filters’ response, ![]() , represented as purple dots. The purple box width gives the bandwidth of the corresponding filter.
, represented as purple dots. The purple box width gives the bandwidth of the corresponding filter.
Current usage metrics show cumulative count of Article Views (full-text article views including HTML views, PDF and ePub downloads, according to the available data) and Abstracts Views on Vision4Press platform.
Data correspond to usage on the plateform after 2015. The current usage metrics is available 48-96 hours after online publication and is updated daily on week days.
Initial download of the metrics may take a while.