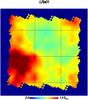
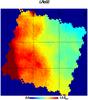
Fig. 5
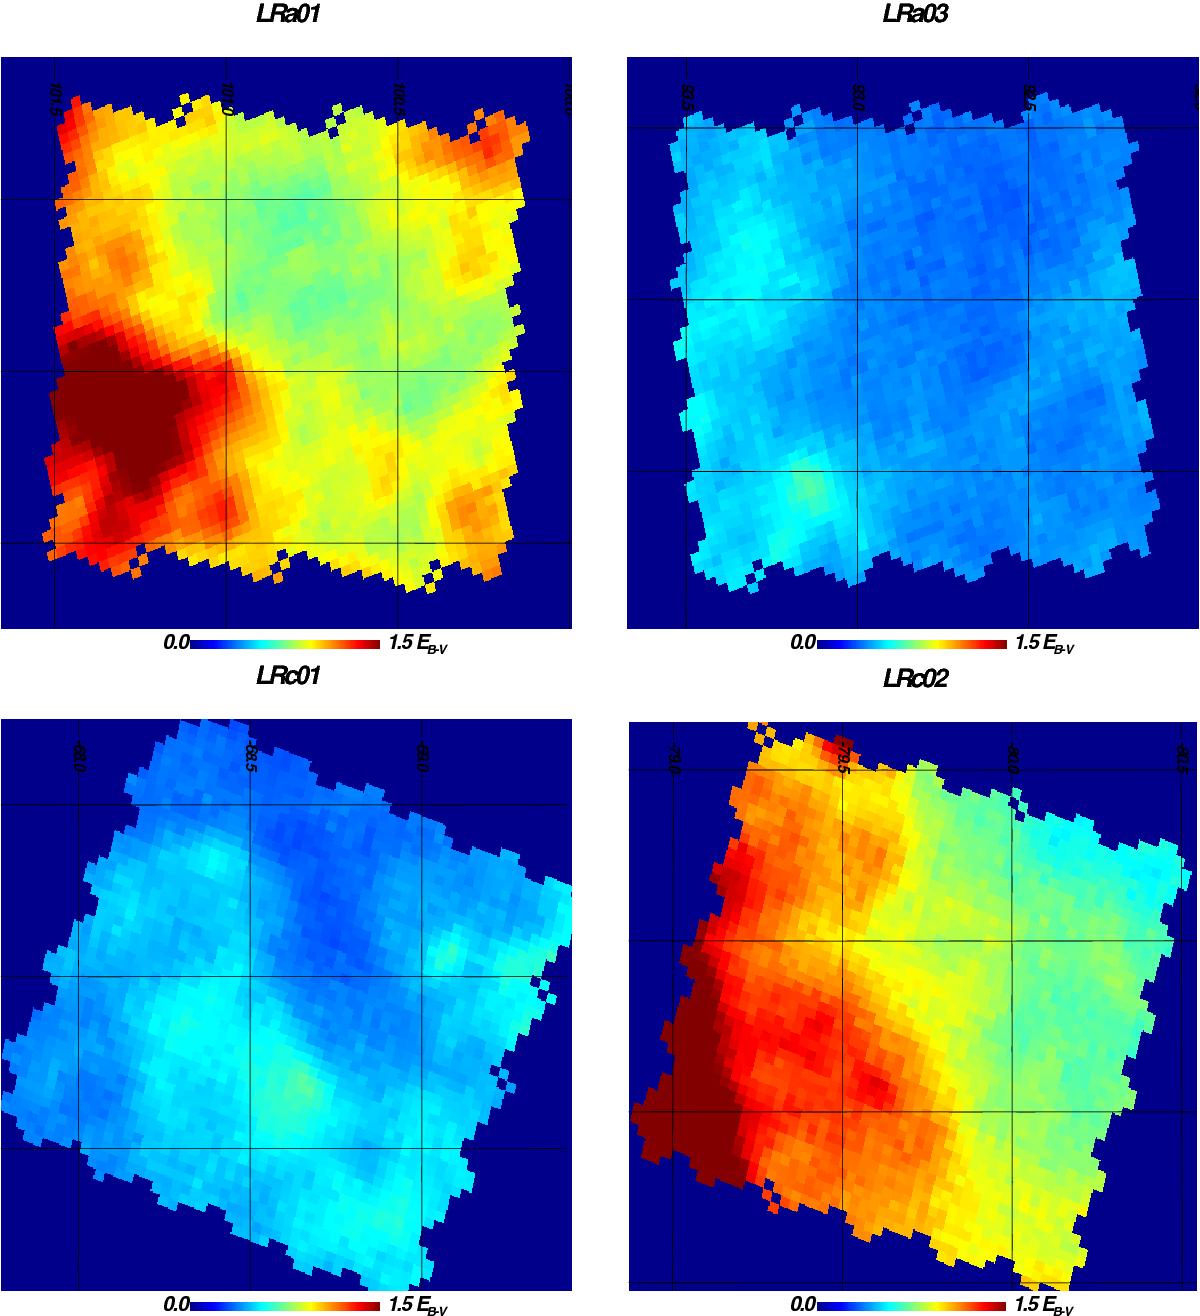
Gnomonic projections of EB−V maps obtained by extracting the region observed by CoRoT from the τ353 maps of Planck. The four panels correspond to the CCD footprint for four runs: LRa01, LRa03, LRc01, and LRc02 as indicated on the figure. The colour scale is the same for all runs; the maximum value was arbitrarily set to 1.5 to allow for an easy comparison of the different panels.
Current usage metrics show cumulative count of Article Views (full-text article views including HTML views, PDF and ePub downloads, according to the available data) and Abstracts Views on Vision4Press platform.
Data correspond to usage on the plateform after 2015. The current usage metrics is available 48-96 hours after online publication and is updated daily on week days.
Initial download of the metrics may take a while.