Fig. 7
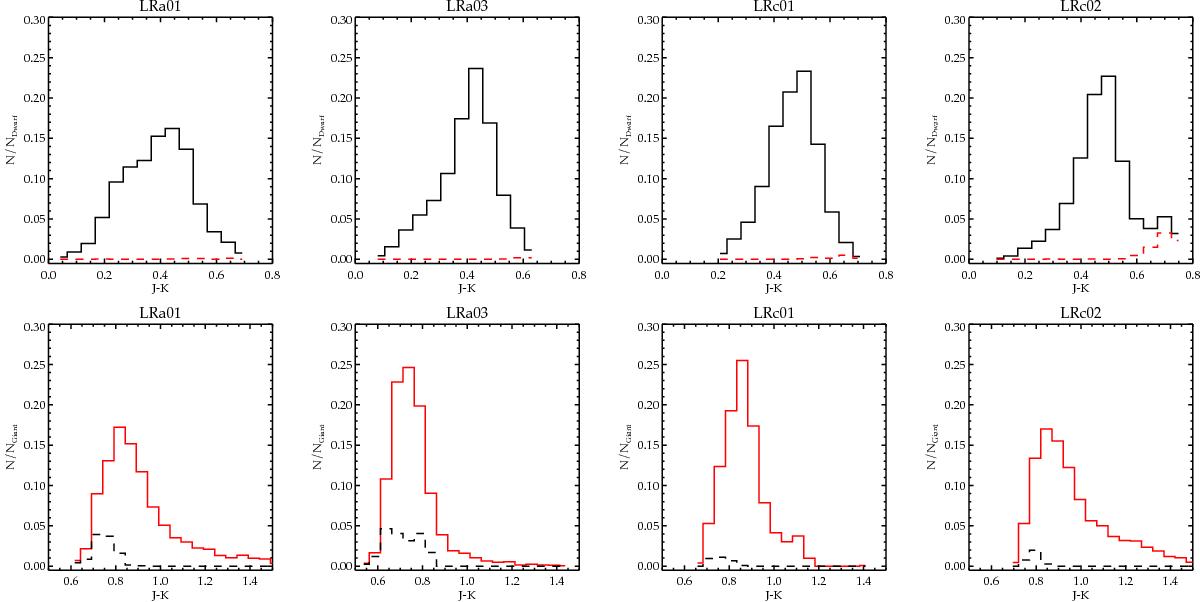
Histogram of J−K for stars classified as dwarfs (top, black solid line) and giants (bottom, red solid line) for different runs. The distribution of giants (stars with log g< 3.5) misclassified as dwarfs is indicated in the top plots with a red dashed line. The distribution of dwarfs (stars with log g ≥ 3.5) misclassified as giants is indicated in the bottom plots with a black dashed line.
Current usage metrics show cumulative count of Article Views (full-text article views including HTML views, PDF and ePub downloads, according to the available data) and Abstracts Views on Vision4Press platform.
Data correspond to usage on the plateform after 2015. The current usage metrics is available 48-96 hours after online publication and is updated daily on week days.
Initial download of the metrics may take a while.