Fig. 6
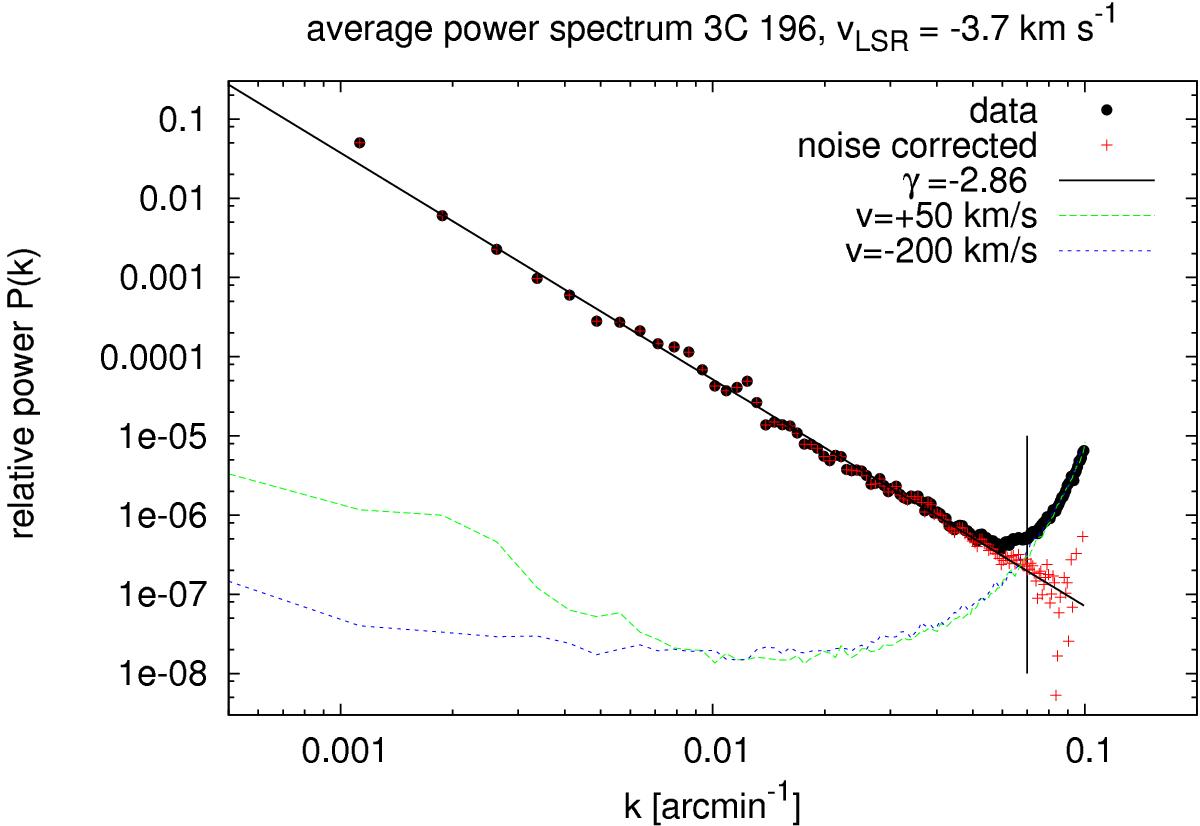
EBHIS averaged angular power spectrum (black dots) at vLSR = −3.76 km s-1. Systematic and statistical uncertainties are estimated quantitatively by the power spectra calculated for emission free portion of the EBHIS data at vLSR = + 50 km s-1 (green) and vLSR = −200 km s-1 (blue). Data after subtraction of a noise template N(k) are plotted in red. The distribution for k< 0.07 arcmin-1 (vertical line) is approximated by a power-law with γ = −2.86 ± 0.03.
Current usage metrics show cumulative count of Article Views (full-text article views including HTML views, PDF and ePub downloads, according to the available data) and Abstracts Views on Vision4Press platform.
Data correspond to usage on the plateform after 2015. The current usage metrics is available 48-96 hours after online publication and is updated daily on week days.
Initial download of the metrics may take a while.