Free Access
Fig. 4
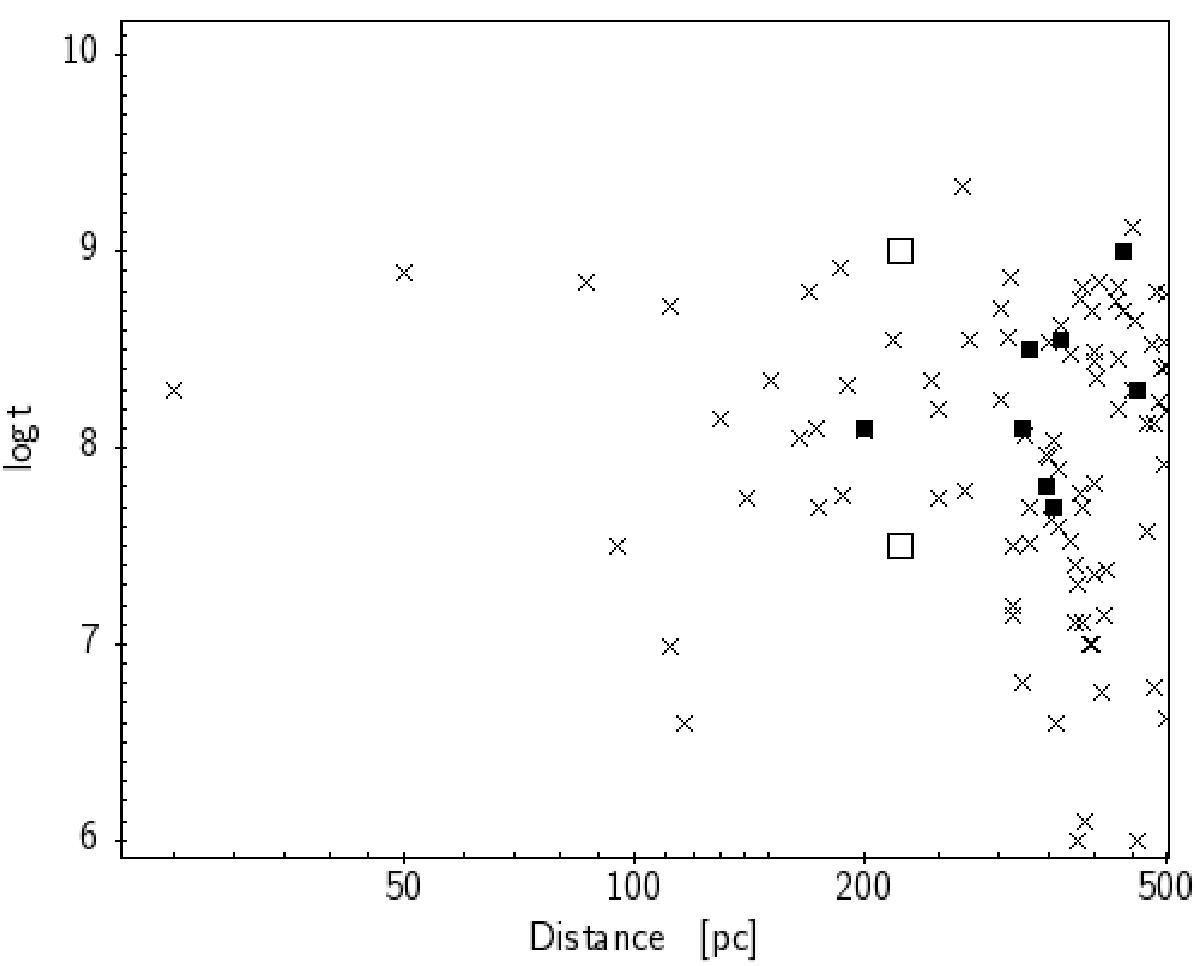
Distances and ages of the newly found clusters within 500 pc. The new clusters are shown as black squares, whereas the MWSC clusters (Kharchenko et al. 2013) are shown as crosses. The open squares indicate the age spread of the cluster RSG9.
Current usage metrics show cumulative count of Article Views (full-text article views including HTML views, PDF and ePub downloads, according to the available data) and Abstracts Views on Vision4Press platform.
Data correspond to usage on the plateform after 2015. The current usage metrics is available 48-96 hours after online publication and is updated daily on week days.
Initial download of the metrics may take a while.