Fig. 18
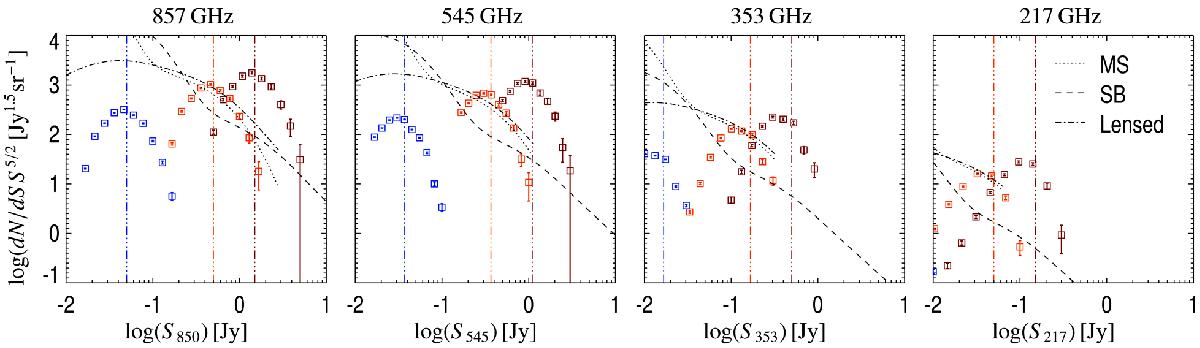
Number counts of PHZ sources in the 857-, 545-, 353-, and 217-GHz bands (from left to right, respectively), where the flux densities have been computed in the cleaned maps and may be affected by the attenuation effect. Three cases are presented, depending on the assumption made about the intrinsic number of objects composing the PHZ source: n = 1 (red); n = 3 (orange); and n = 30 (blue). The vertical dash-dot-dot-dotted lines provide the 80% completeness limit of the PHZ catalogue at each frequency, estimated from Monte Carlo quality assessment (MCQA) simulations. The predictions of the Béthermin et al. (2012) model integrated between redshift 1.5 and 4 are shown for three populations of sources: main sequence (dotted line); starburst (dashed line); and lensed (dot-dash line).
Current usage metrics show cumulative count of Article Views (full-text article views including HTML views, PDF and ePub downloads, according to the available data) and Abstracts Views on Vision4Press platform.
Data correspond to usage on the plateform after 2015. The current usage metrics is available 48-96 hours after online publication and is updated daily on week days.
Initial download of the metrics may take a while.