Fig. C.1
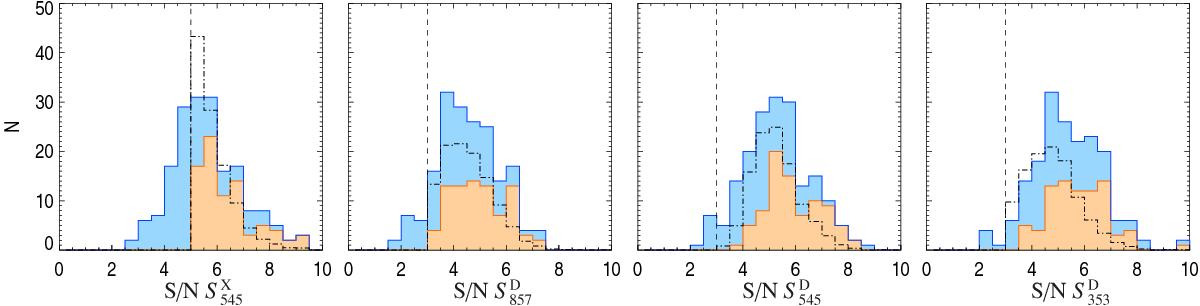
Distribution of the S/N in the excess and cleaned Planck maps at the coordinates of the 182 sources of the Herschel sample that exhibit a detection in the deep list obtained with a 1σ threshold in all bands. The distribution of the 83 sources followed up by Herschel and present in the PHZ is shown in orange, while the rest of the sample is shown in blue. The distribution of the full PHZ is shown in dot-dashed black line, scaled by a factor 1/20. The dashed lines show the S/N thresholds required in all bands for a detection.
Current usage metrics show cumulative count of Article Views (full-text article views including HTML views, PDF and ePub downloads, according to the available data) and Abstracts Views on Vision4Press platform.
Data correspond to usage on the plateform after 2015. The current usage metrics is available 48-96 hours after online publication and is updated daily on week days.
Initial download of the metrics may take a while.