Fig. C.3
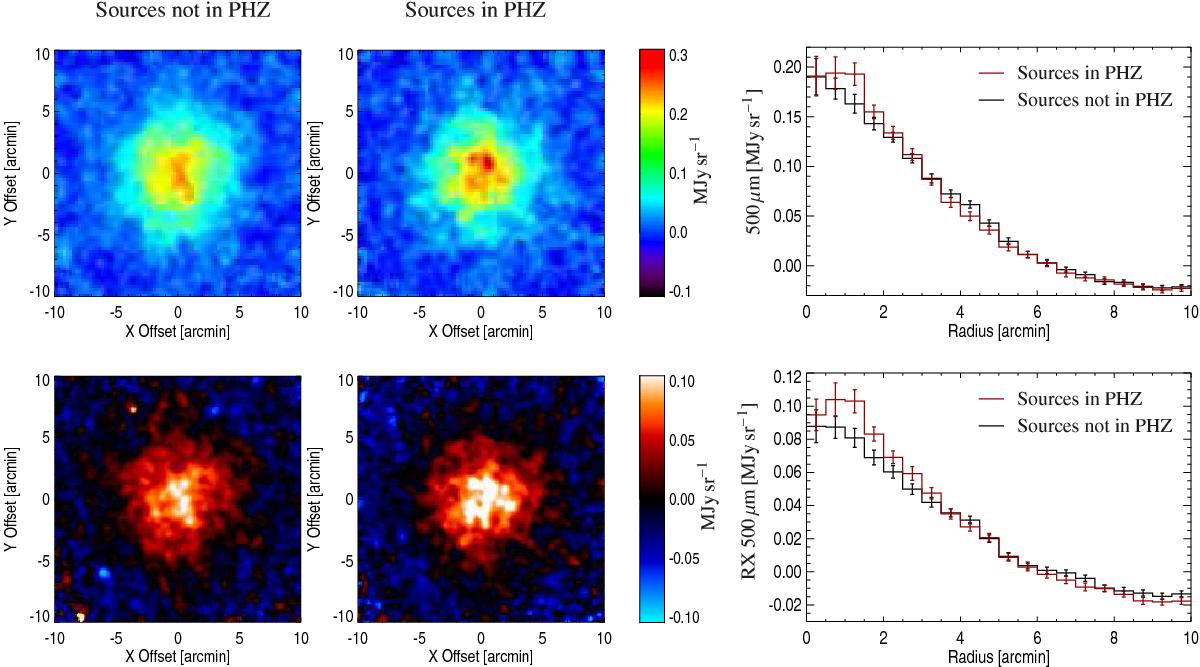
Stacking analysis on two sub-samples of sources followed up with Herschel, depending on their presence in the final PHZ. Top: stacked maps and radial profiles obtained on the 500 μm Herschel-SPIRE intensity maps. Bottom: stacked maps and radial profiles obtained on the 500 μm Herschel-SPIRE red excess maps. Error bars have been obtained via bootstrapping.
Current usage metrics show cumulative count of Article Views (full-text article views including HTML views, PDF and ePub downloads, according to the available data) and Abstracts Views on Vision4Press platform.
Data correspond to usage on the plateform after 2015. The current usage metrics is available 48-96 hours after online publication and is updated daily on week days.
Initial download of the metrics may take a while.