Fig. 9
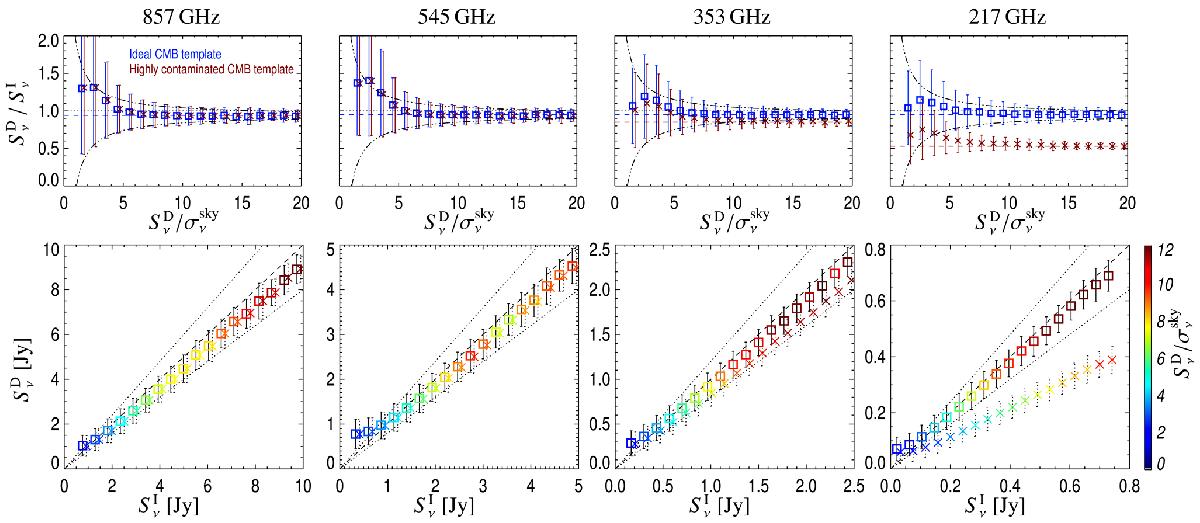
Flux density recovery, from left to right, at 857, 545, 353, and 217 GHz. Top: ratio of the recovered to the input flux density (![]() /
/![]() ) as a function of the recovered flux density S/N,
) as a function of the recovered flux density S/N, ![]() . This is shown for two choices of the CMB template, i.e., ideal (blue squares) or highly contaminated by extragalactic foregrounds (red crosses). The average bias at high S/N is shown with a dashed line, while the ±1σ envelope expected at each S/N is plotted as a dash-dot-dot-dot line. The error bars correspond to the ±1σ standard deviation computed over the sub-sample of sources in each bin of S/N. Bottom: recovered (
. This is shown for two choices of the CMB template, i.e., ideal (blue squares) or highly contaminated by extragalactic foregrounds (red crosses). The average bias at high S/N is shown with a dashed line, while the ±1σ envelope expected at each S/N is plotted as a dash-dot-dot-dot line. The error bars correspond to the ±1σ standard deviation computed over the sub-sample of sources in each bin of S/N. Bottom: recovered (![]() ) versus input (
) versus input (![]() ) flux density per bin of input flux density. Again, two cases are shown depending on the quality of the CMB template, ideal (square) or highly contaminated (crosses). The colour scale provides the average S/N of the flux density inside each bin of input flux density. The dotted lines show the ± 20% limits around the 1:1 relation (dashed line).
) flux density per bin of input flux density. Again, two cases are shown depending on the quality of the CMB template, ideal (square) or highly contaminated (crosses). The colour scale provides the average S/N of the flux density inside each bin of input flux density. The dotted lines show the ± 20% limits around the 1:1 relation (dashed line).
Current usage metrics show cumulative count of Article Views (full-text article views including HTML views, PDF and ePub downloads, according to the available data) and Abstracts Views on Vision4Press platform.
Data correspond to usage on the plateform after 2015. The current usage metrics is available 48-96 hours after online publication and is updated daily on week days.
Initial download of the metrics may take a while.