Fig. 3
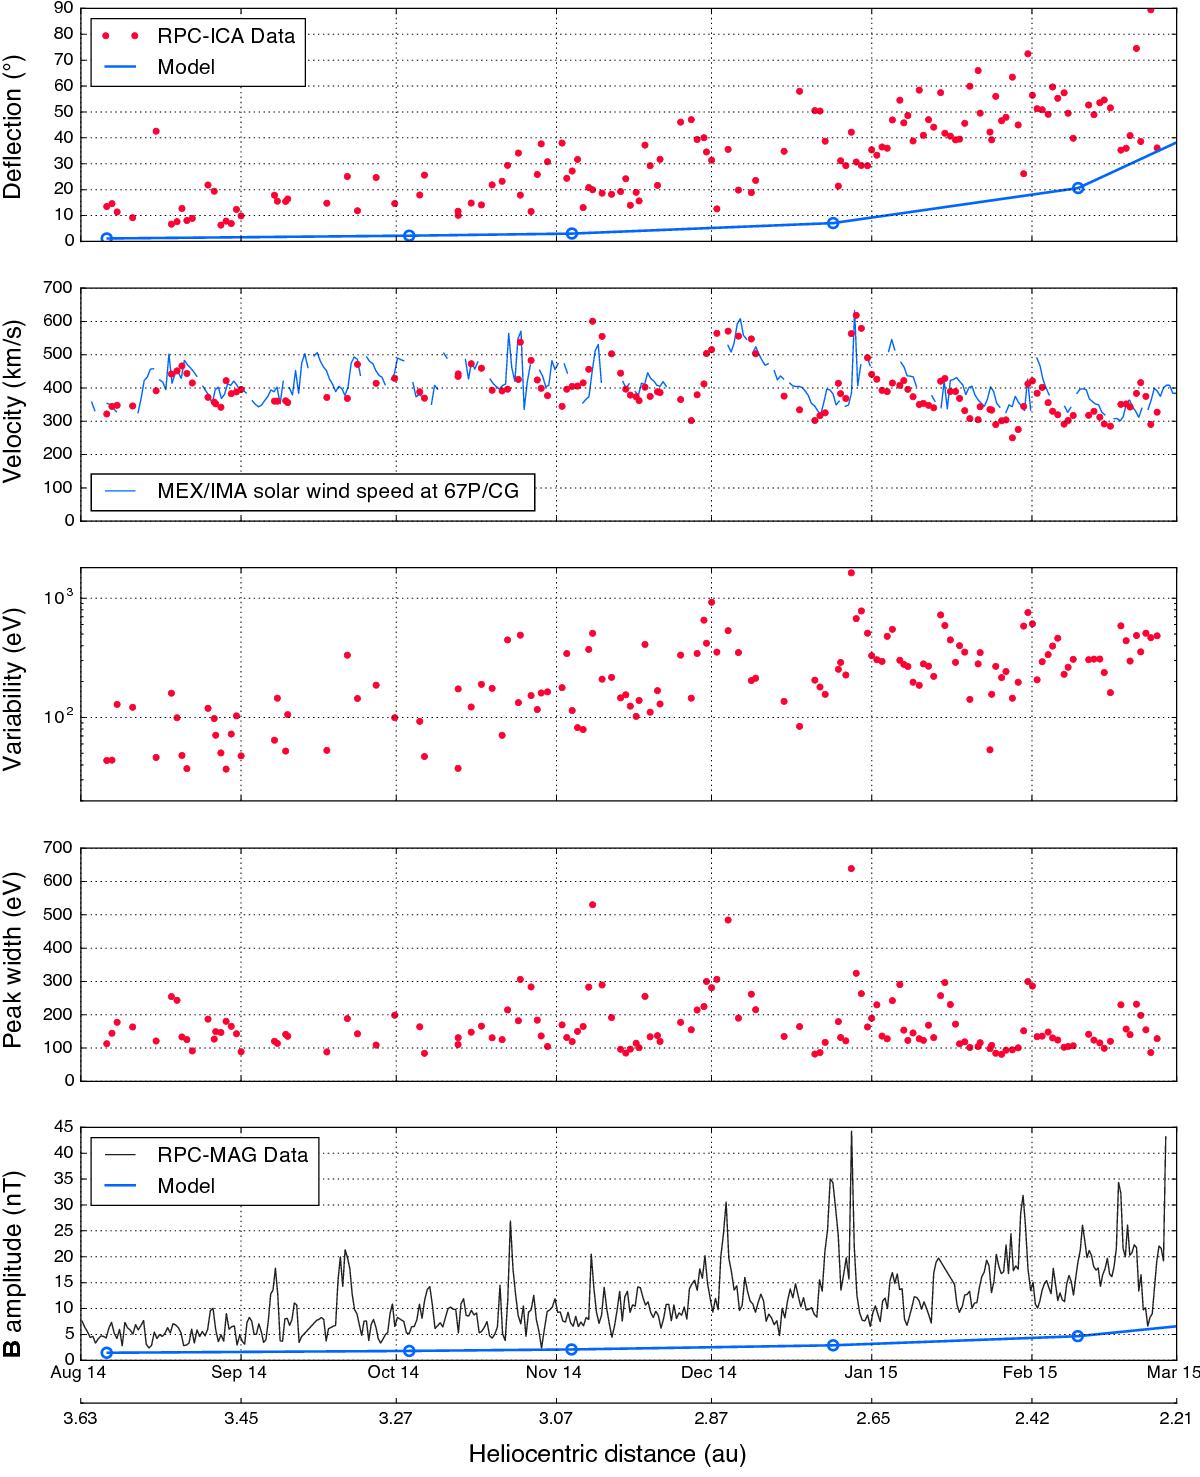
Time series for: deflection angle (first panel), speed (second panel), energy distribution width (third panel), peak centre variability (fourth panel) and magnetic field amplitude (last panel). RPC-ICA data are given by red dots – every dot is a daily median. Peak width and peak central value are given by the fit parameters. RPC-MAG magnetic field amplitude is averaged over 10 h. Blue lines are either results from the hybrid model (first and last panels) or results from the MEX solar wind speed propagation (second panel from top).
Current usage metrics show cumulative count of Article Views (full-text article views including HTML views, PDF and ePub downloads, according to the available data) and Abstracts Views on Vision4Press platform.
Data correspond to usage on the plateform after 2015. The current usage metrics is available 48-96 hours after online publication and is updated daily on week days.
Initial download of the metrics may take a while.