Fig. 1
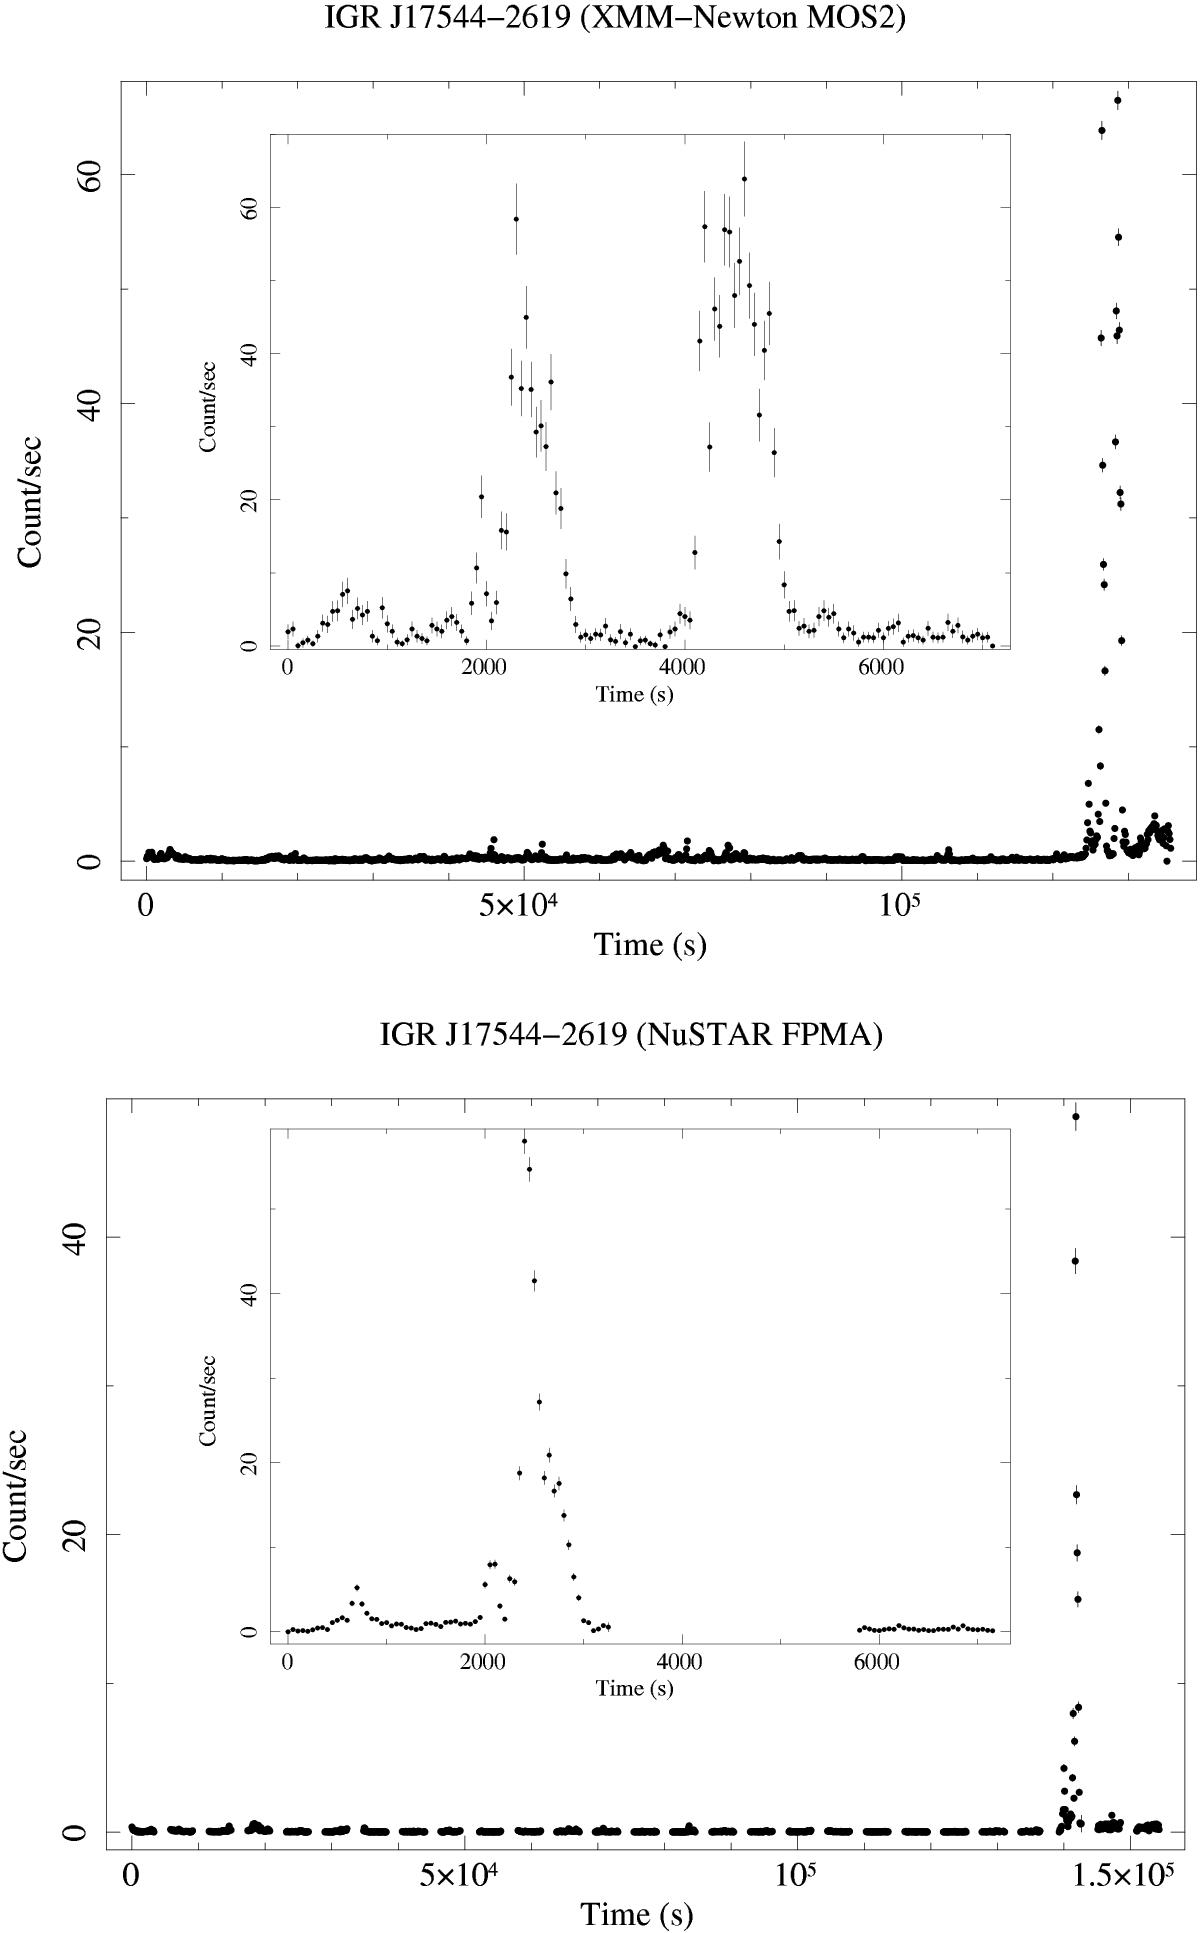
Top: XMM-Newton MOS2 lightcurve of IGR J17544-2619 in the 0.5−10 keV energy band. The lightcurve has not been filtered for the high flaring background time intervals. The insert shows a zoom in the outburst of the source occurring towards the end of the observation and comprised of three distinct flares. The time bin of the main lightcurve is 100 s, while for the lightcurve in the insert we used a time bin of 50 s. The start time of the main lightcurve is 2015 March 20 at 06:02:34 UTC (57 101.2518 MJD), while the start time of the zoomed lightcurve in the insert is 2015 March 21 at 15:48:44 UTC (57 102.6588 MJD). Bottom: NuSTAR FPMA lightcurve in the 5−10 keV energy band. The time bin is 100 s and the start time is 2015 March 20 at 1:06 UTC (57 101.0458 MJD). The inset shows a zoom into the flaring part of the NuSTAR lightcurve (in this case the start and the bin times are the same as those of the inset in the top figure).
Current usage metrics show cumulative count of Article Views (full-text article views including HTML views, PDF and ePub downloads, according to the available data) and Abstracts Views on Vision4Press platform.
Data correspond to usage on the plateform after 2015. The current usage metrics is available 48-96 hours after online publication and is updated daily on week days.
Initial download of the metrics may take a while.