Fig. 2
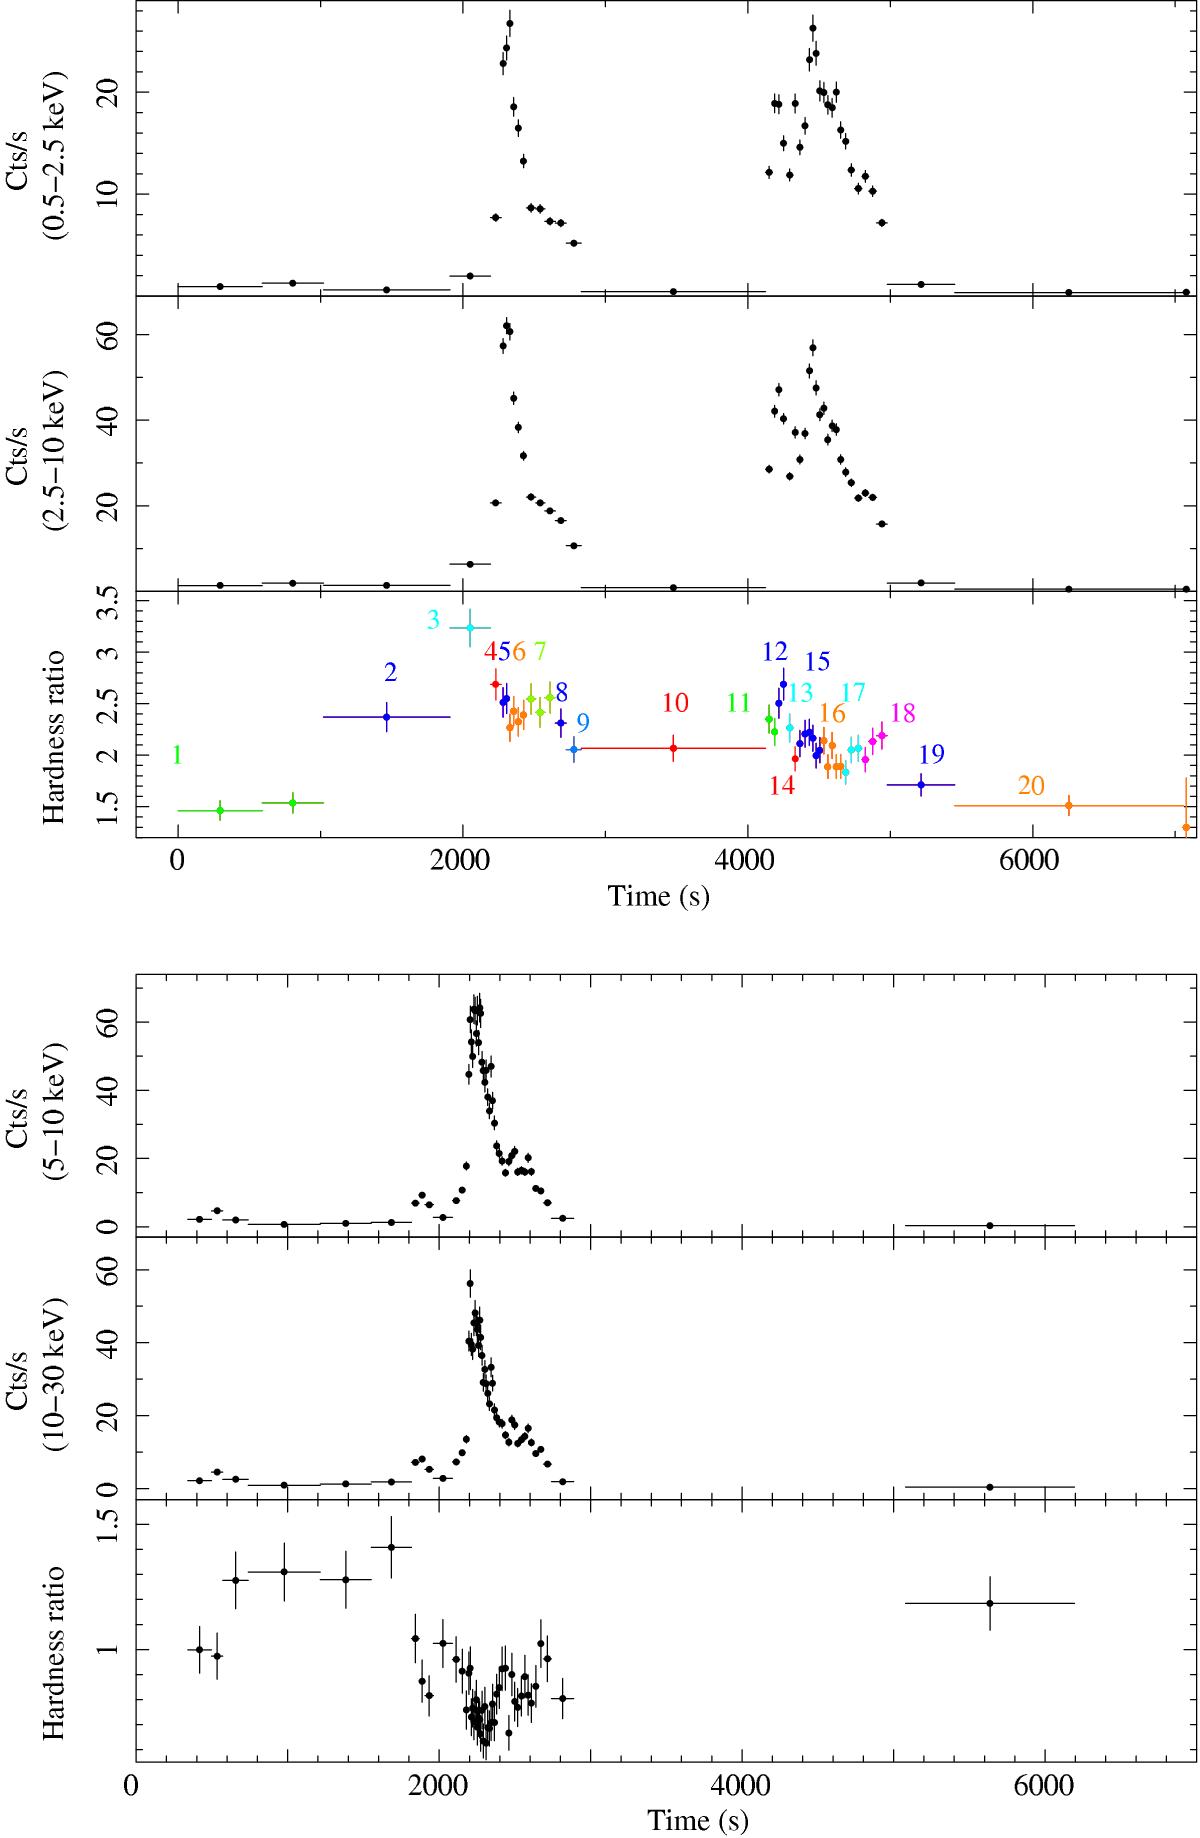
Lightcurves in different energy bands and the corresponding hardness ratio obtained from the flaring part of the XMM-Newton (top) and NuSTAR (bottom) observations. In both cases an adaptive rebinning has been used to achieve S/N ≳ 15 in each bin. We do not show the quiescent portion of the lightcurve, as there, the statistics were much lower than during flares and thus no meaningful HR resolved spectral analysis could be carried out. Here the start time of the NuSTAR and XMM-Newton lightcurves are the same. The third flare could not be detected by NuSTAR due to visibility constraints. In the top figure, we highlighted the 20 intervals in which the HR-resolved spectra analyzed in Sect. 3 have been extracted with different colors.
Current usage metrics show cumulative count of Article Views (full-text article views including HTML views, PDF and ePub downloads, according to the available data) and Abstracts Views on Vision4Press platform.
Data correspond to usage on the plateform after 2015. The current usage metrics is available 48-96 hours after online publication and is updated daily on week days.
Initial download of the metrics may take a while.