Fig. 3
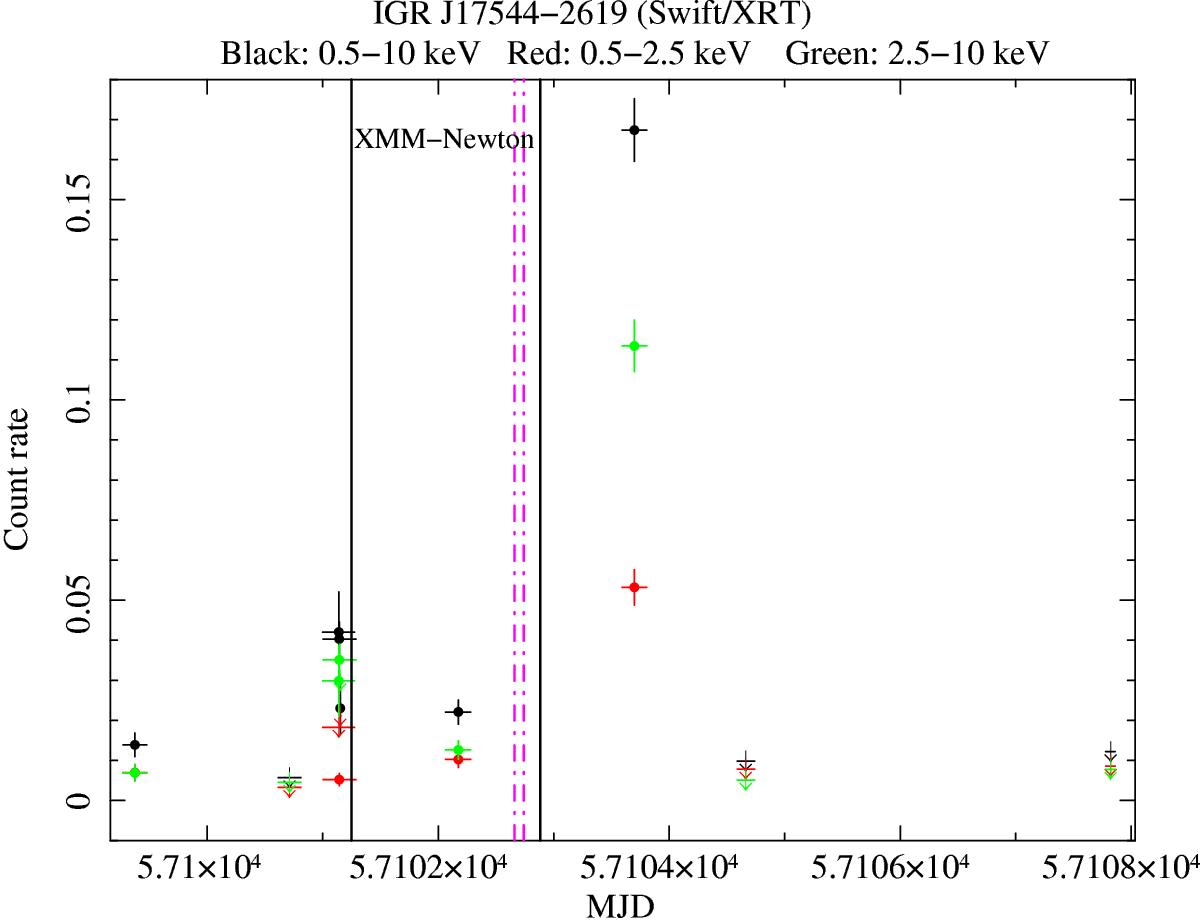
Lightcurves obtained from the Swift /XRT monitoring campaign performed a few days before and after the XMM-Newton and NuSTAR observations of IGR J17544-2619 (we mark in black the lightcurve in the 0.5−10 keV energy range, in red the lightcurve in the 0.5−2.5 keV energy range, and in green the lightcurve in the 2.5−10 keV energy range). The time is measured from the 57 102 MJD, as in Fig. 1. The faint flare recorded by XRT, which is visible above when the source count-rate reaches approximately 0.17 cts s-1, occurred on 57 103.7 MJD, that is, roughly one day after the onset of the much brighter outburst observed by XMM-Newton and NuSTAR. The downward arrows indicate 3σ upper limits on the source count-rate when IGR J17544-2619 was not detected in the corresponding XRT observation. We also marked with vertical solid lines the time interval of the XMM-Newton observation (the NuSTAR observation is nearly simultaneous). The vertical, dashed magenta lines indicate the time interval of the 7 ks outburst detected by XMM-Newton and NuSTAR (see Sects. 2.1 and 2.2).
Current usage metrics show cumulative count of Article Views (full-text article views including HTML views, PDF and ePub downloads, according to the available data) and Abstracts Views on Vision4Press platform.
Data correspond to usage on the plateform after 2015. The current usage metrics is available 48-96 hours after online publication and is updated daily on week days.
Initial download of the metrics may take a while.