Fig. 4
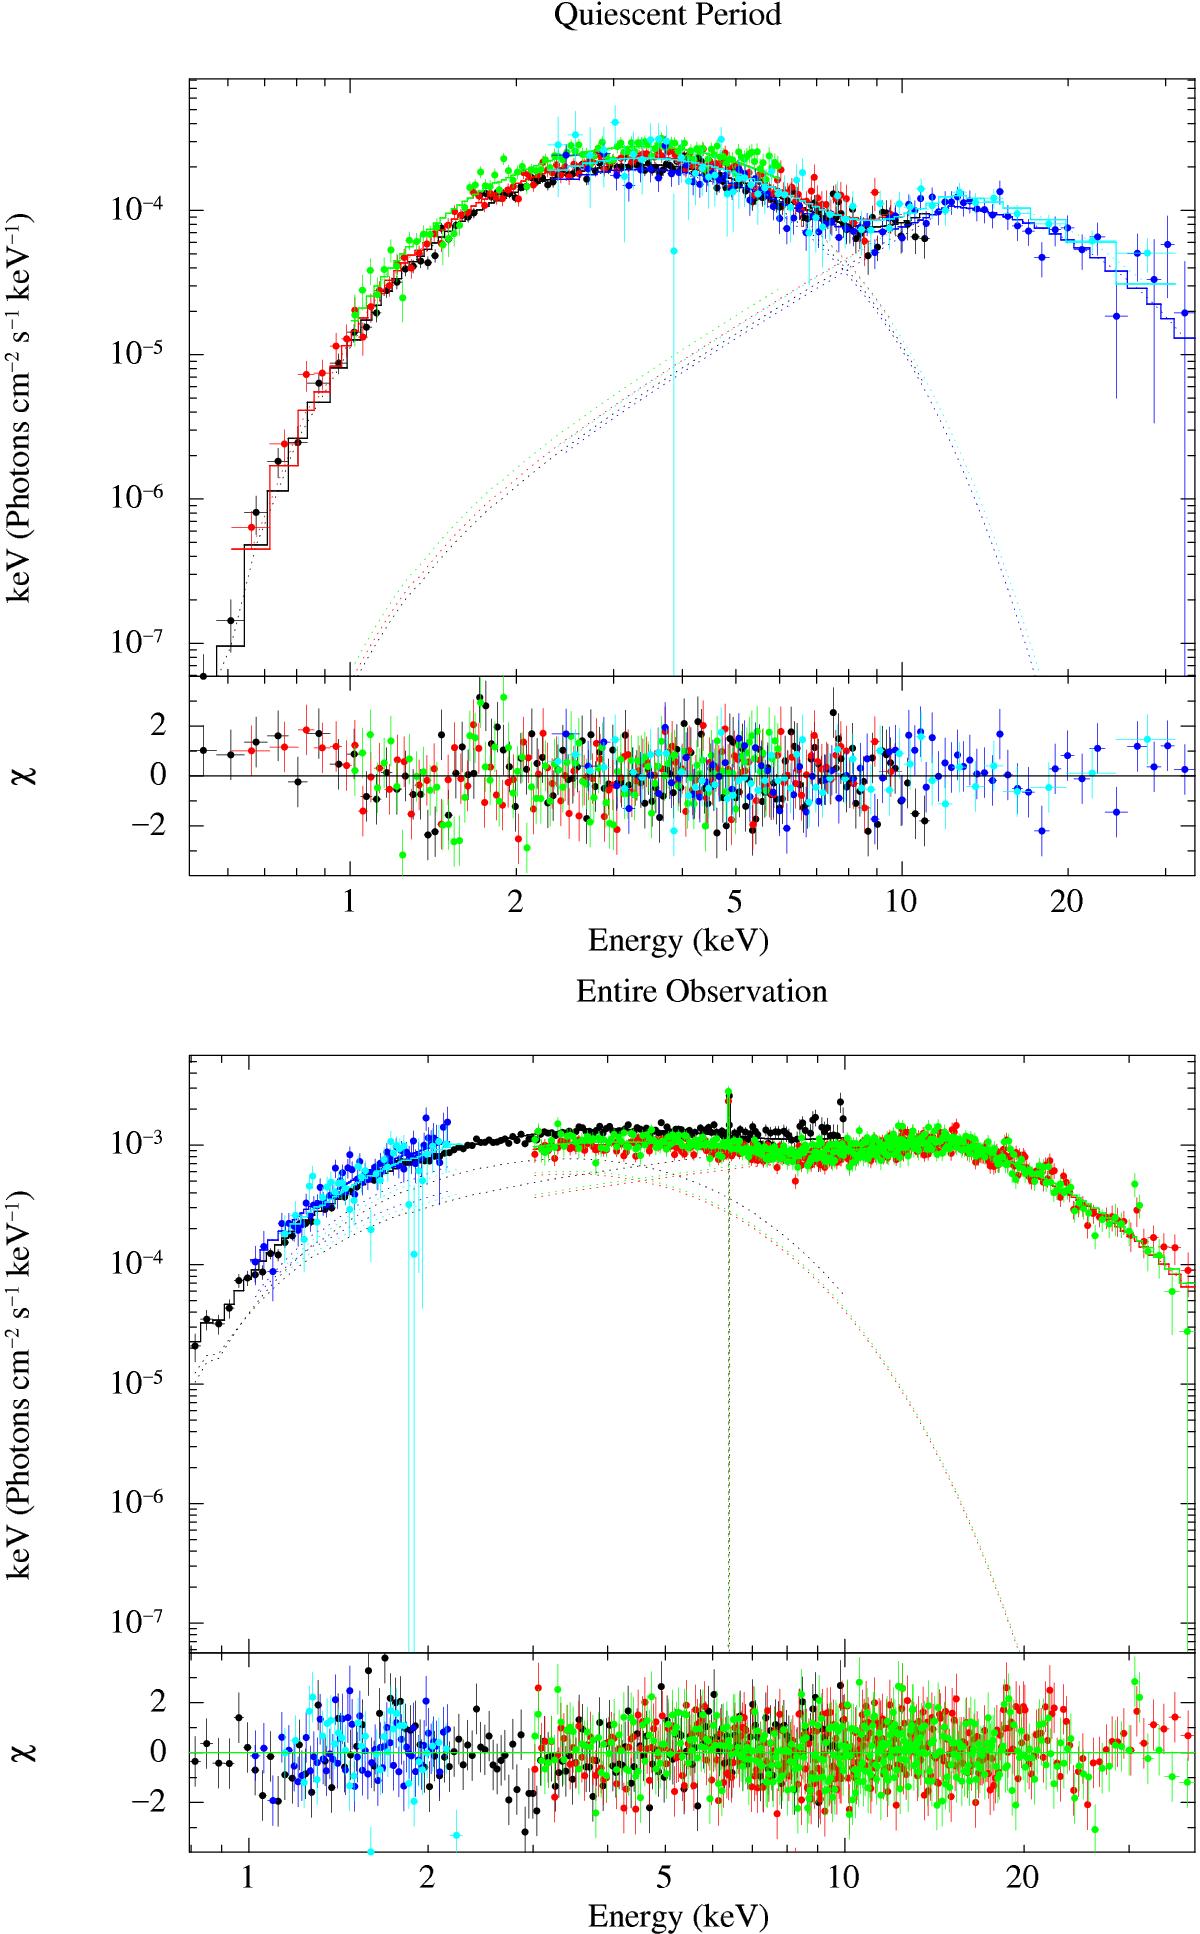
Top: combined XMM-Newton and NuSTAR unfolded spectra extracted during the first ~120 ks of the observations, when the source was in a quiescent state. The EPIC-pn is in black, the MOS2 in red, the MOS1 in green, the FPMA in blue, and the FPMB in cyan. The best fit model is obtained by using a combination of an absorbed blackbody plus a power-law with a high energy cut-off (see Sect. 3 for details). The residuals from the best fit are shown in the bottom panel. Bottom: same as above but for the spectra accumulated during the entire observational period. The MOS2 is in black, the FPMA in red, the FPMB in green, the RGS1 in blue, and the RGS2 in cyan. The same model as above plus a weak iron emission line at ~6.4 keV, has been used to obtain the best fit. Residuals from this fit are shown in the bottom panel.
Current usage metrics show cumulative count of Article Views (full-text article views including HTML views, PDF and ePub downloads, according to the available data) and Abstracts Views on Vision4Press platform.
Data correspond to usage on the plateform after 2015. The current usage metrics is available 48-96 hours after online publication and is updated daily on week days.
Initial download of the metrics may take a while.