Fig. 6
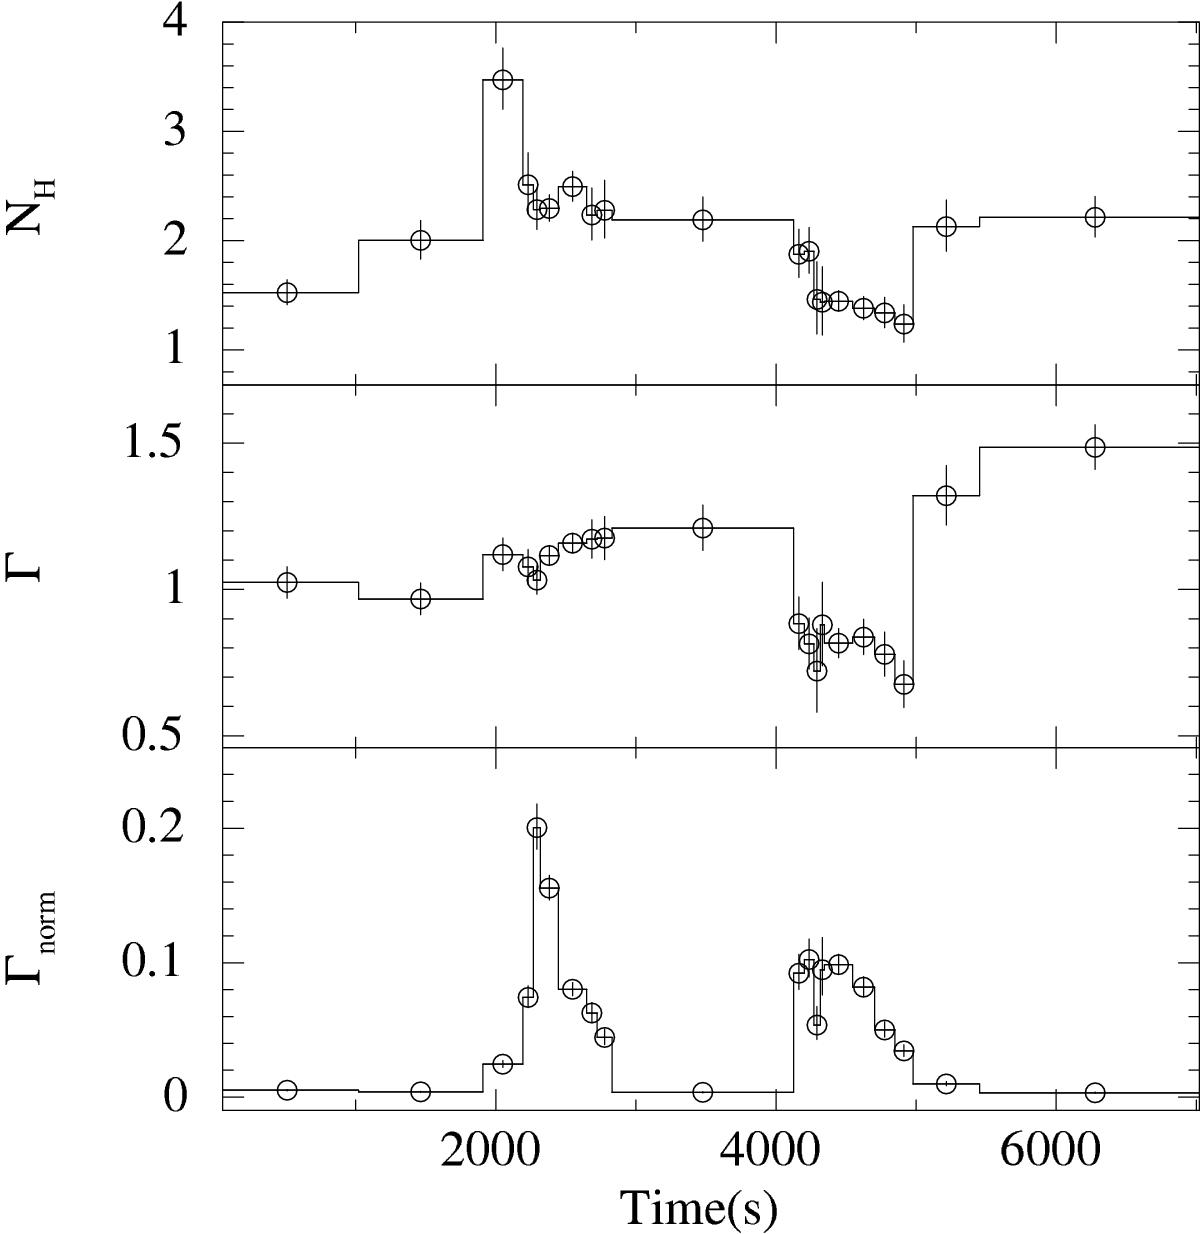
Results obtained when the time-resolved XMM-Newton data alone are fitted with a simple absorbed power-law model. From the top to the bottom panel we show the absorption column density, the power-law photon index, and its normalization. As discussed in the text, it is evident that the most prominent spectral changes took place during the second flare (the first one being much fainter than the other two and occurring in this figure at approximately t = 500 s). The uncertainties on the x axis correspond to the integration times of the spectra 1−20 in Fig. 2.
Current usage metrics show cumulative count of Article Views (full-text article views including HTML views, PDF and ePub downloads, according to the available data) and Abstracts Views on Vision4Press platform.
Data correspond to usage on the plateform after 2015. The current usage metrics is available 48-96 hours after online publication and is updated daily on week days.
Initial download of the metrics may take a while.