Fig. 7
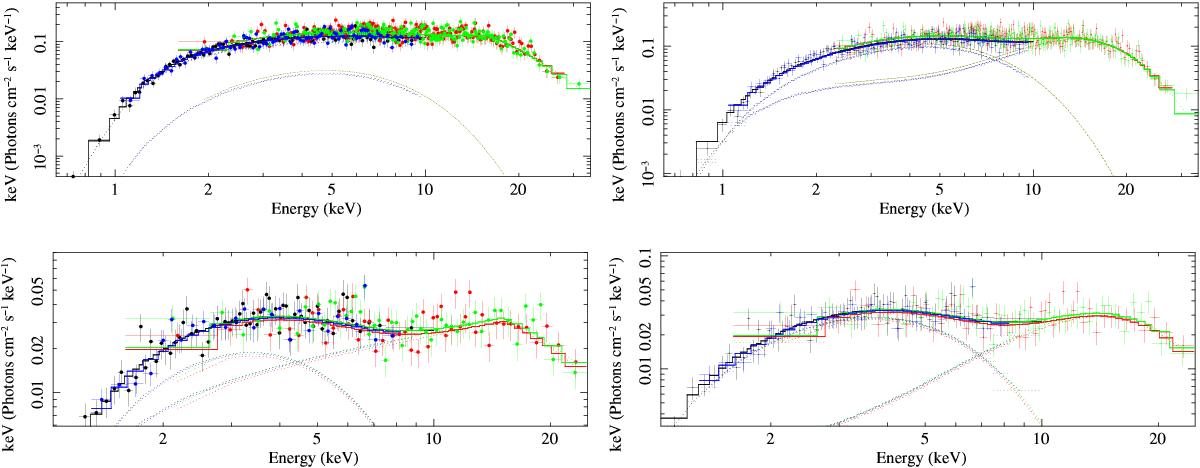
An example of combined XMM-Newton and NuSTAR spectra during the decay from the second flare, as indicated in Fig. 2. We chose the spectra from the time interval 6 (top panel) and 9 (bottom panel) as examples to show how the source X-ray spectral emission evolves during the flare. For the figures on the left, the non-thermal component is described through the usage of a phenomenological highecut*pow model in xspec. For the panel on the right, the non-thermal component is fit by using the physical BW model (see Sect. 4). In both cases, it is evident that the non-thermal component dominates the source high-energy emission at higher fluxes (e.g., during the time interval used to extract the spectrum 6). The thermal component provides an increasingly important contribution to the overall emission during the decay from the flare (e.g., during the time interval used to extract the spectrum 9). The relative contribution of the thermal and non-thermal components is different in the fits performed with the phenomenological and physical spectral models, but the overall picture used to interpret the spectral change is qualitatively similar.
Current usage metrics show cumulative count of Article Views (full-text article views including HTML views, PDF and ePub downloads, according to the available data) and Abstracts Views on Vision4Press platform.
Data correspond to usage on the plateform after 2015. The current usage metrics is available 48-96 hours after online publication and is updated daily on week days.
Initial download of the metrics may take a while.