Free Access
Fig. 5
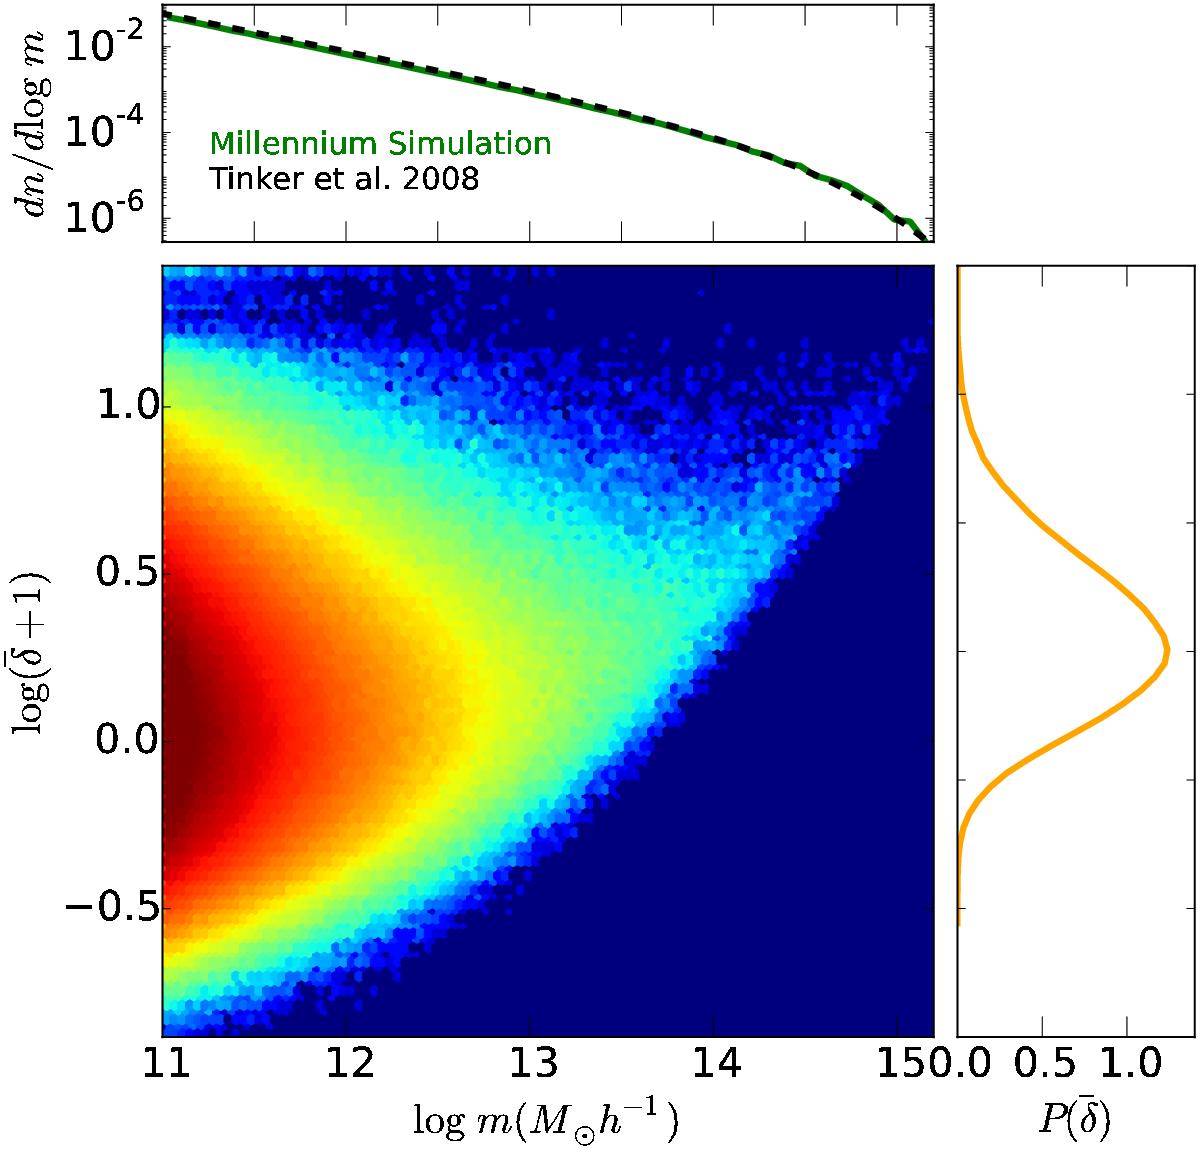
Distribution of haloes in local density ![]() and mass m. The colours show the number of haloes that are in a density
and mass m. The colours show the number of haloes that are in a density ![]() and have a mass m. Right panel shows the
and have a mass m. Right panel shows the ![]() distribution from the contribution of all the haloes,
distribution from the contribution of all the haloes, ![]() . The top panel shows the Halo Mass Function.
. The top panel shows the Halo Mass Function.
Current usage metrics show cumulative count of Article Views (full-text article views including HTML views, PDF and ePub downloads, according to the available data) and Abstracts Views on Vision4Press platform.
Data correspond to usage on the plateform after 2015. The current usage metrics is available 48-96 hours after online publication and is updated daily on week days.
Initial download of the metrics may take a while.