Fig. 2
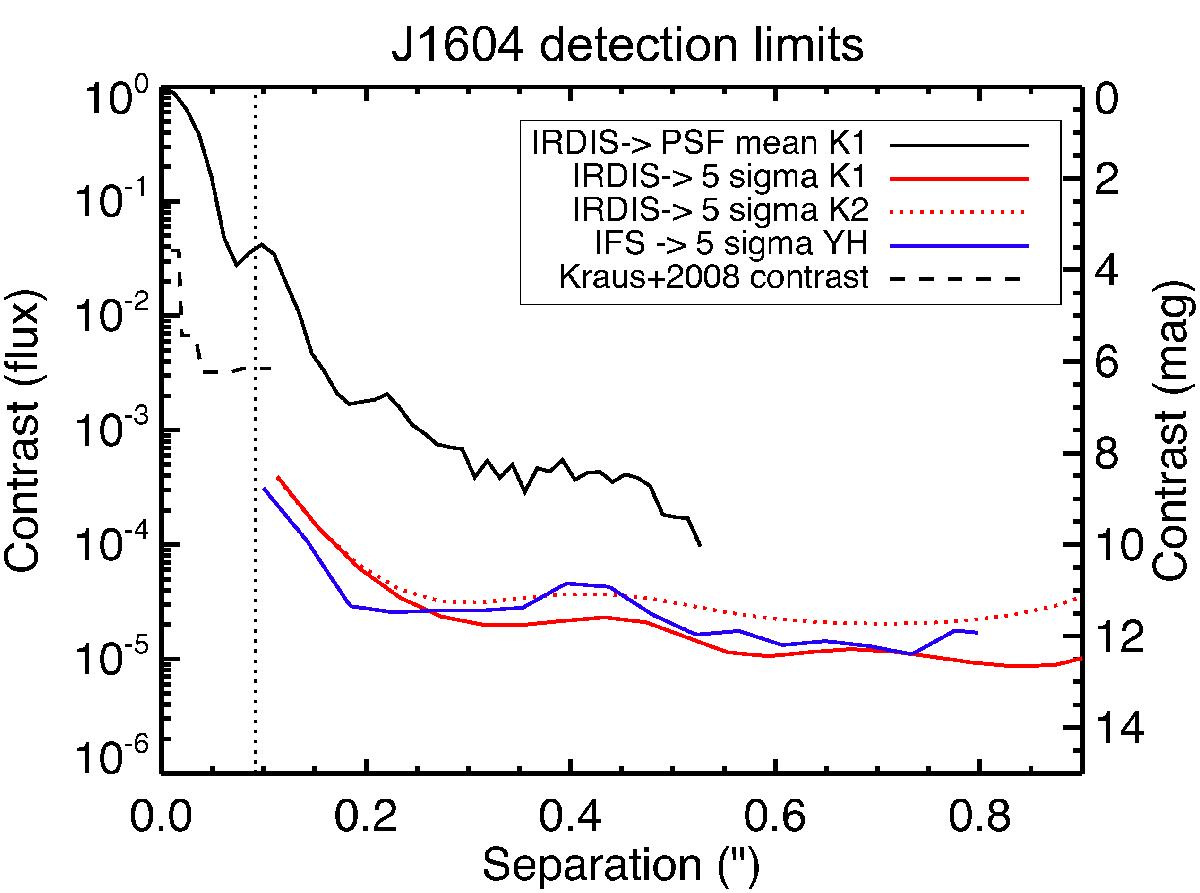
Azimuthally averaged contrast curves (5σ detection limits) derived using the methods described in Sect. 5.1. The black solid line traces the contrast of the averaged off-axis PSF at K1-band. The vertical dotted line indicates the IWA of our images. The dashed line indicates the detection limits derived by Kraus et al. (2008).
Current usage metrics show cumulative count of Article Views (full-text article views including HTML views, PDF and ePub downloads, according to the available data) and Abstracts Views on Vision4Press platform.
Data correspond to usage on the plateform after 2015. The current usage metrics is available 48-96 hours after online publication and is updated daily on week days.
Initial download of the metrics may take a while.