Fig. 6
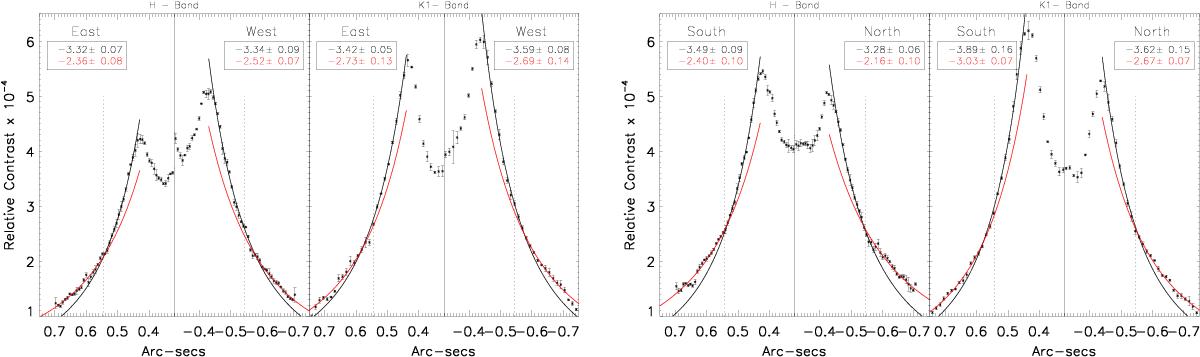
Cuts along the disk major (left panel) and minor (right panel) axis. Each panel shows the cuts at H and K1-bands. Black asterisks and error bars represent the median and standard deviation at each position over a 3-px width slit along the major axis. A broken power-law profile is fitted at each side of the profile. The power-law indices are given in the legends of each panel, with the same color code as the fits plotted as solid curves, and correspond to the values listed in Table 1 (major axis) and Table 2 (minor axis). The vertical dotted line indicates the ~ 79 au cavity in the mm-sized grains (Zhang et al. 2014). The cuts are given in contrast (units of 10-4) with respect to the star at each band.
Current usage metrics show cumulative count of Article Views (full-text article views including HTML views, PDF and ePub downloads, according to the available data) and Abstracts Views on Vision4Press platform.
Data correspond to usage on the plateform after 2015. The current usage metrics is available 48-96 hours after online publication and is updated daily on week days.
Initial download of the metrics may take a while.