Fig. 5
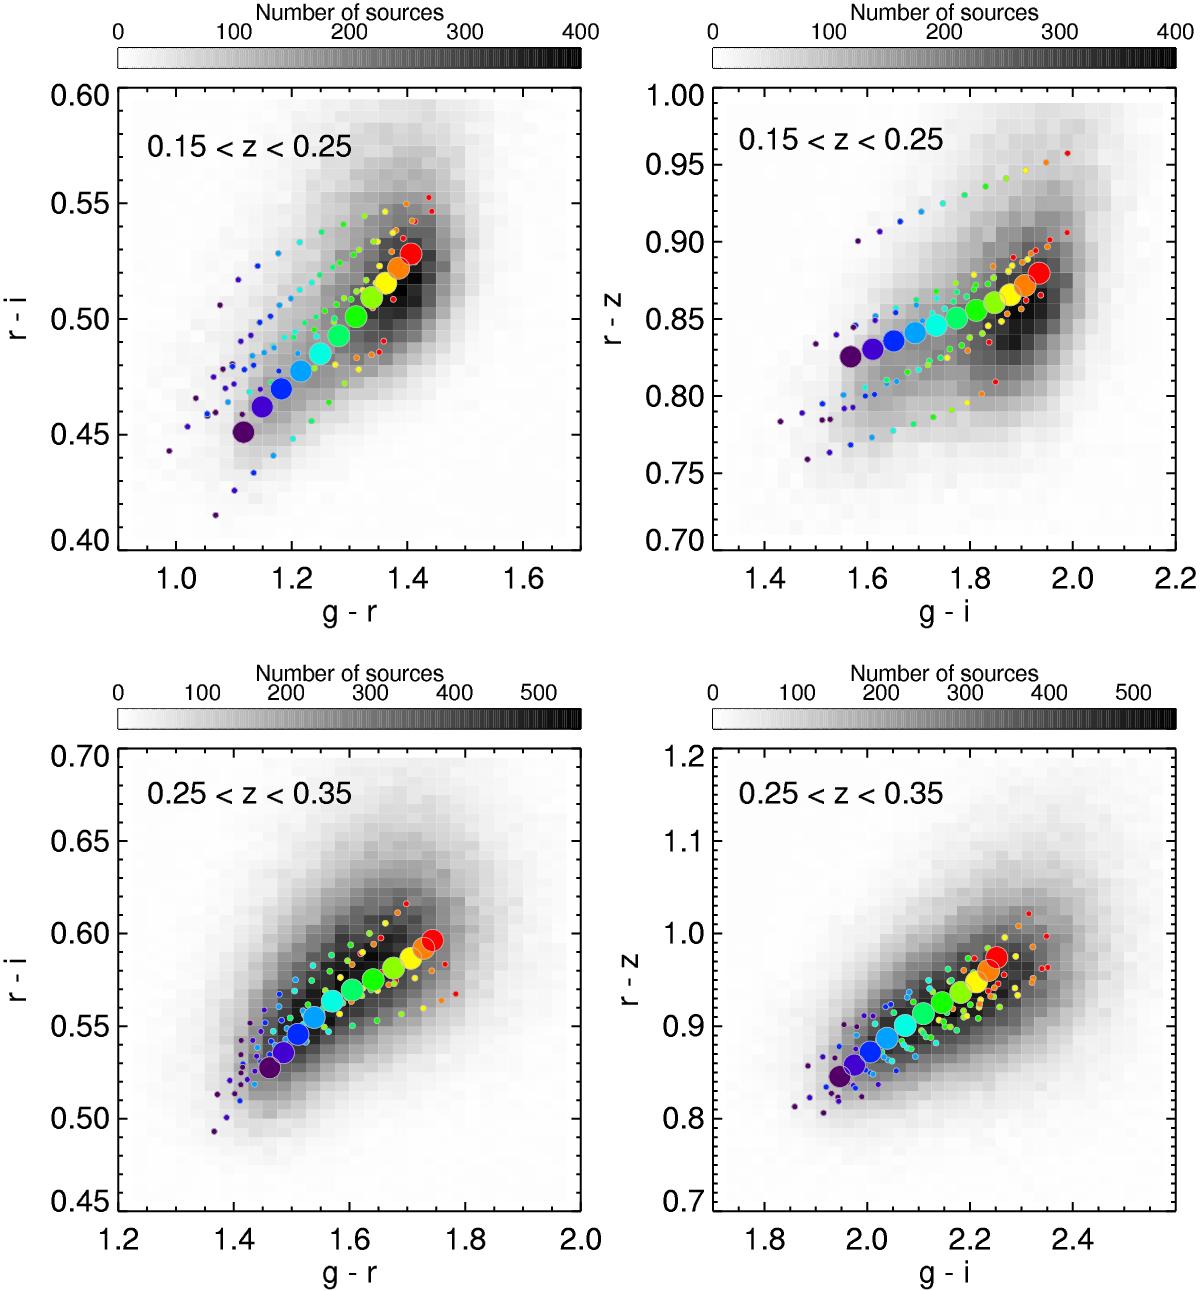
Colour–colour diagrams (left panels: r−i vs. g−r; right: r−z vs. g−i) of SDSS LRG in two redshift bins (top: 0.15 < z < 0.25; bottom: 0.25 < z < 0.35). The grey colour map accounts for the density of sources. Galaxy colours are derived from extinction-corrected griz model magnitudes (see text for details). The coloured small-dotted tracks show the colours of two template libraries from Greisel et al. (2013) for LRG at z ~ 0.2 and z ~ 0.3 (top: z = [0.15,0.25]; bottom: z = [0.25,0.35]; bin = 0.01; purple to red shows increasing redshift). The two optimal templates at z ~ 0.2 and z ~ 0.3 adopted as reference template for the calibration of the dust-to-reddening factor are shown by the larger dotted tracks.
Current usage metrics show cumulative count of Article Views (full-text article views including HTML views, PDF and ePub downloads, according to the available data) and Abstracts Views on Vision4Press platform.
Data correspond to usage on the plateform after 2015. The current usage metrics is available 48-96 hours after online publication and is updated daily on week days.
Initial download of the metrics may take a while.