Fig. 6
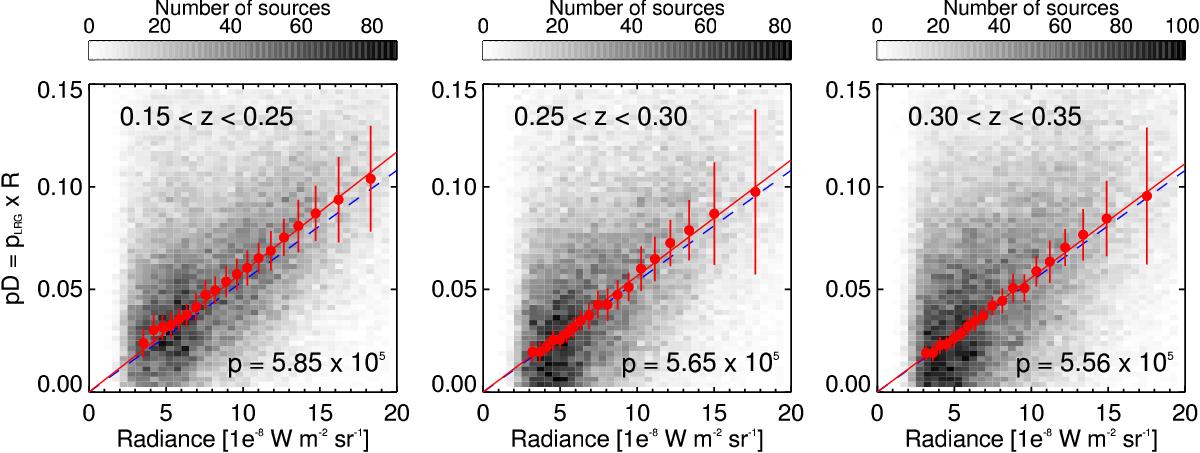
Estimates of pD as a function of R from the Planck radiance map measured along the line of sight of SDSS red galaxies at 0.15 < z < 0.25 (left), 0.25 < z < 0.30 (middle) and 0.30 < z < 0.35 (right). The grey colour map accounts for the density of sources. The red dots (and error bars) represent the median (and standard deviation) estimated through bootstrapping resampling of pD and R within the range 2 < R < 20 × 10-8 W m-2 sr-1 split in 20 bins of equal number of sources. The red line is a linear fit to the dots. We find pLRG ~ 5.85, 5.65 and 5.56 × 10⁵ m2 sr W-1 for 0.15 < z < 0.25, 0.25 < z < 0.30 and 0.30 < z < 0.35 respectively. The blue dashed line shows the pP14 = 5.4 × 10⁵ derived by P14 from a quasar sample at 0.7 < z < 1.7 (P14).
Current usage metrics show cumulative count of Article Views (full-text article views including HTML views, PDF and ePub downloads, according to the available data) and Abstracts Views on Vision4Press platform.
Data correspond to usage on the plateform after 2015. The current usage metrics is available 48-96 hours after online publication and is updated daily on week days.
Initial download of the metrics may take a while.