Fig. 6
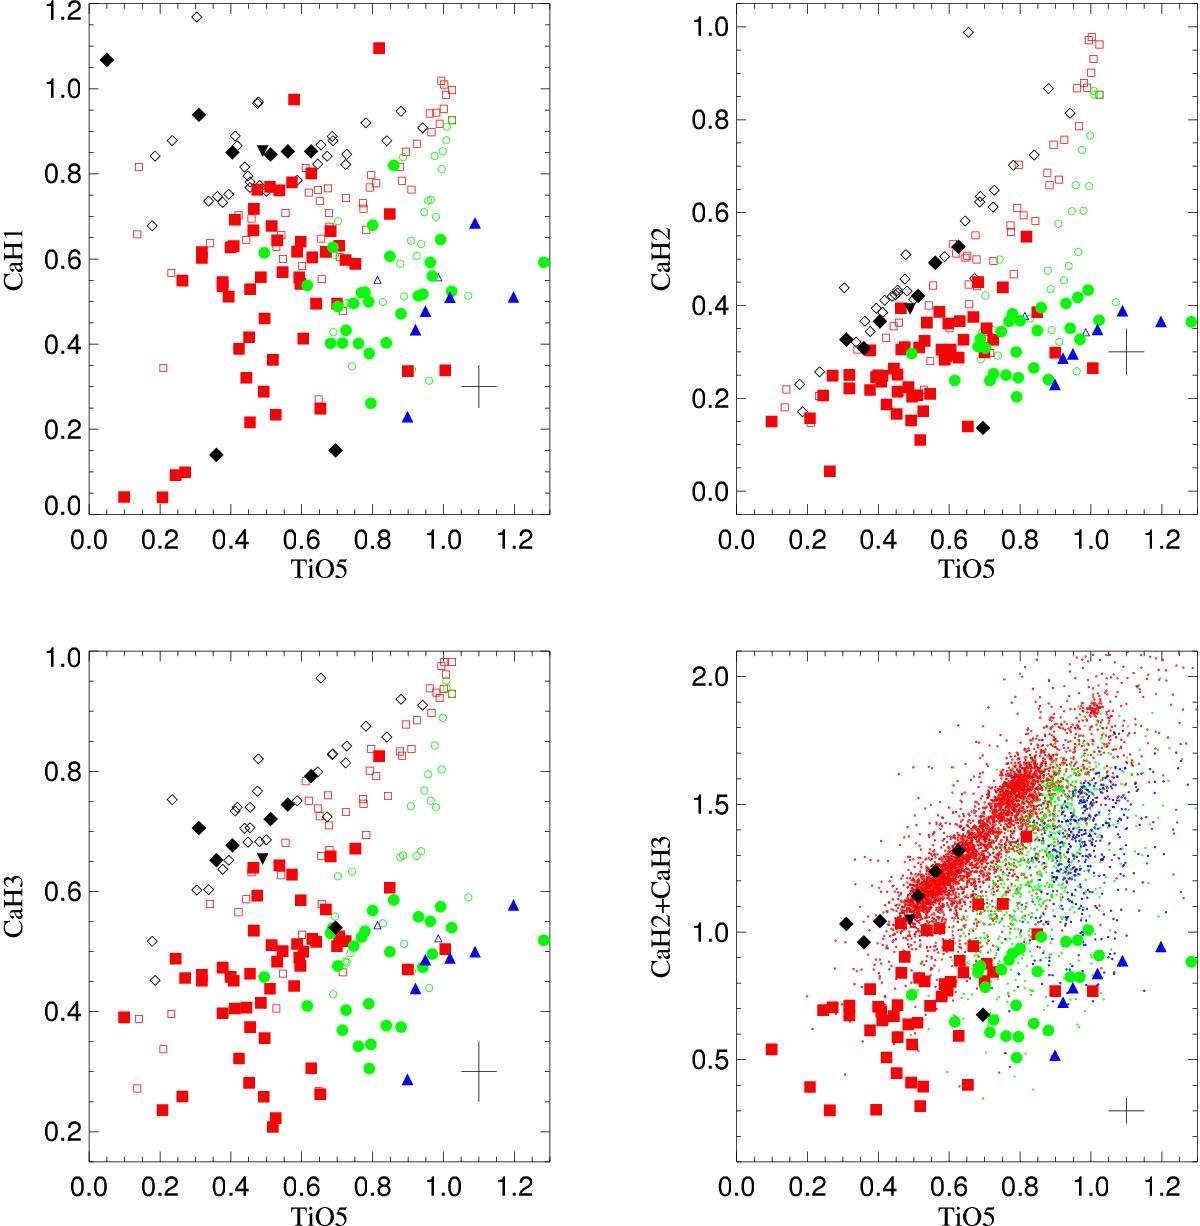
Distribution of subdwarfs as a function of their spectral indices. Symbols are as in Fig. 1. The bottom right plot shows the CaH2+CaH3 vs. TiO5 diagram for objects classified as sdM, esdM, or usdM (small diamonds in red, green, and blue, respectively) in the SDSS spectroscopic database. Plots originally presented in Gizis (1997) and Lépine et al. (2007), updated with our discoveries.
Current usage metrics show cumulative count of Article Views (full-text article views including HTML views, PDF and ePub downloads, according to the available data) and Abstracts Views on Vision4Press platform.
Data correspond to usage on the plateform after 2015. The current usage metrics is available 48-96 hours after online publication and is updated daily on week days.
Initial download of the metrics may take a while.