Fig. 4
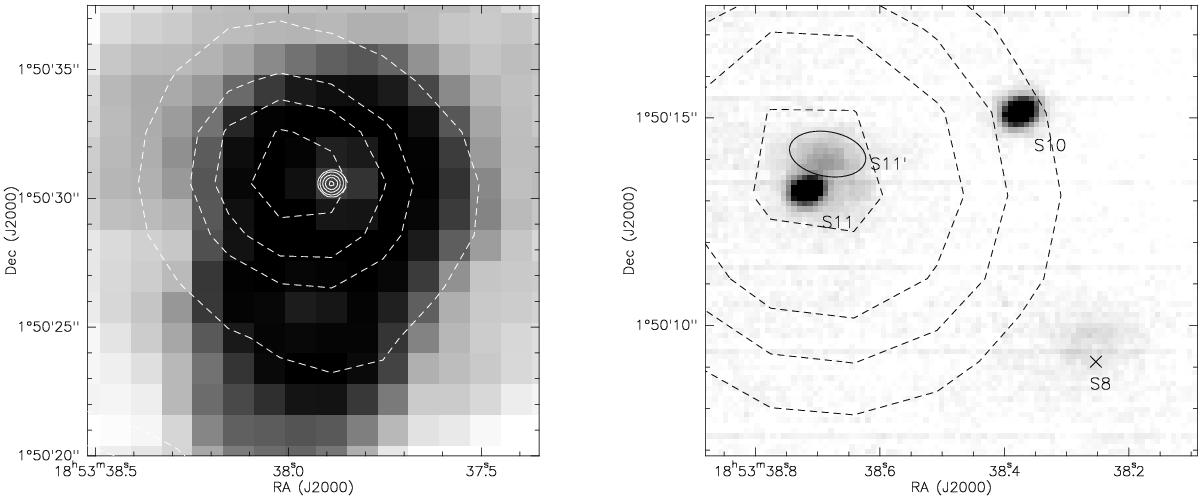
Left: IRAC image of S7 at 8.0 μm with the 17.7 μm emission shown as solid line contours. Right: S10 and S11 through 8.6 μm (PAH1) filter. An ellipse is drawn to show the location of S11′, diffuse emission associated with S11. The dashed contours in both panels represent the radio emission at 8.5 GHz at levels 0.04, 0.08, 0.1 and 0.12 mJy/beam (left) and 0.2, 0.3, 0.4 and 0.55 mJy/beam (right) where beam size is 9.̋2 × 7.̋5 (Sánchez-Monge et al. 2011).
Current usage metrics show cumulative count of Article Views (full-text article views including HTML views, PDF and ePub downloads, according to the available data) and Abstracts Views on Vision4Press platform.
Data correspond to usage on the plateform after 2015. The current usage metrics is available 48-96 hours after online publication and is updated daily on week days.
Initial download of the metrics may take a while.