Fig. 5
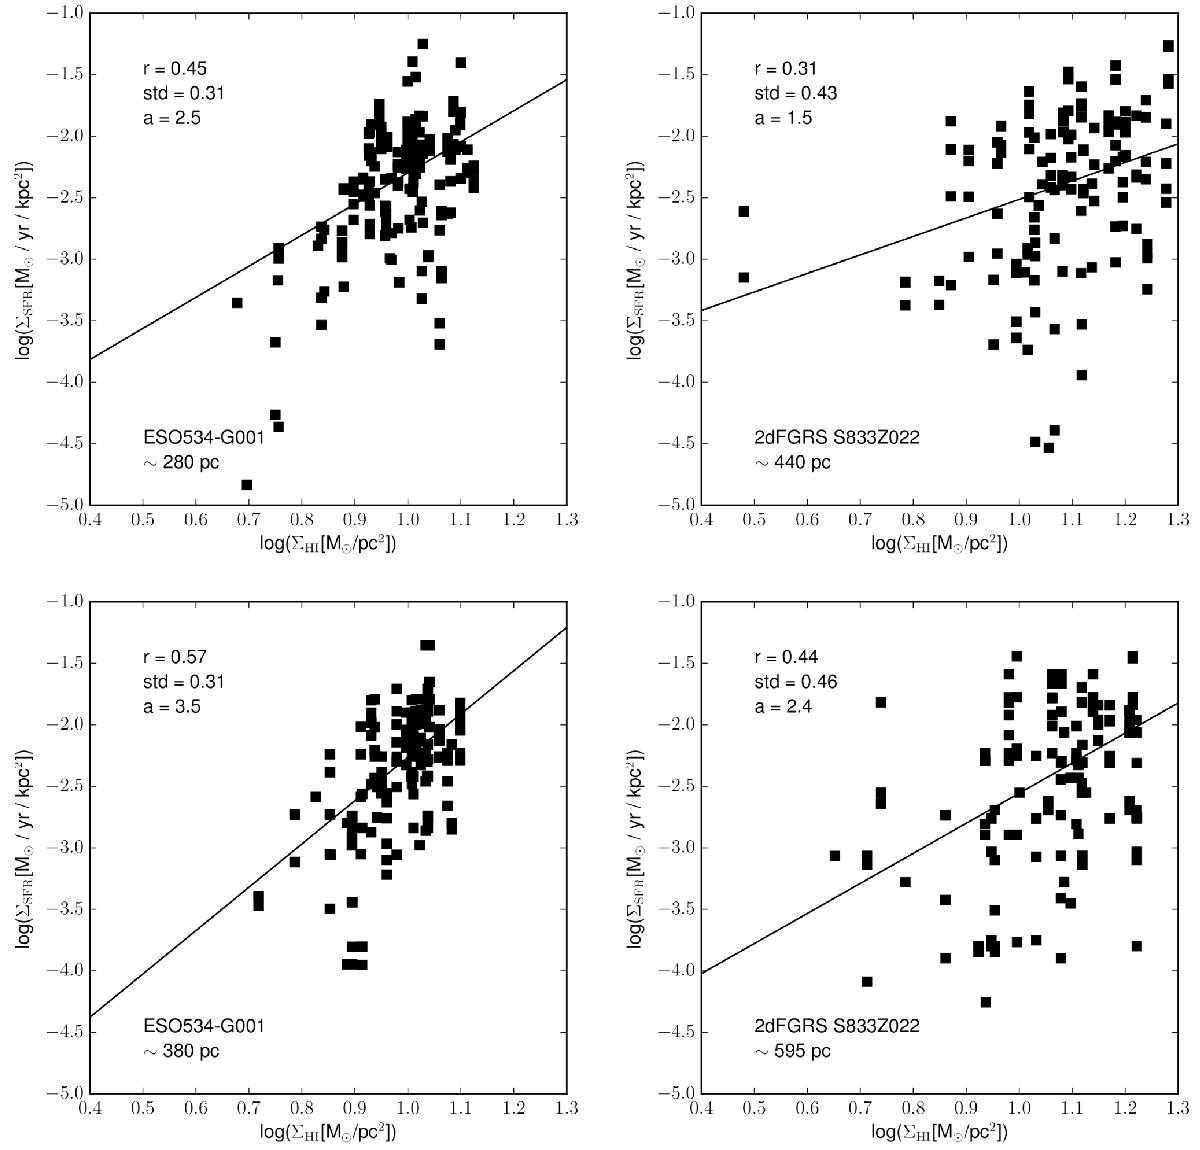
ΣSFR vs. ΣHI of GalA (left) and GalB (right). The solid line shows a power-law fit to the data. The spatial resolution for each plot is given in the lower left corner. r is the correlation coefficient, std is the corrected sample standard deviation, and a is the power-law index. From top to bottom, the spatial resolution decreases in steps of ~100 pc for GalA and ~150 pc for GalB. The highest spatial resolution presented is ~280 pc for GalA and ~440 pc for GalB.
Current usage metrics show cumulative count of Article Views (full-text article views including HTML views, PDF and ePub downloads, according to the available data) and Abstracts Views on Vision4Press platform.
Data correspond to usage on the plateform after 2015. The current usage metrics is available 48-96 hours after online publication and is updated daily on week days.
Initial download of the metrics may take a while.