Fig. 2
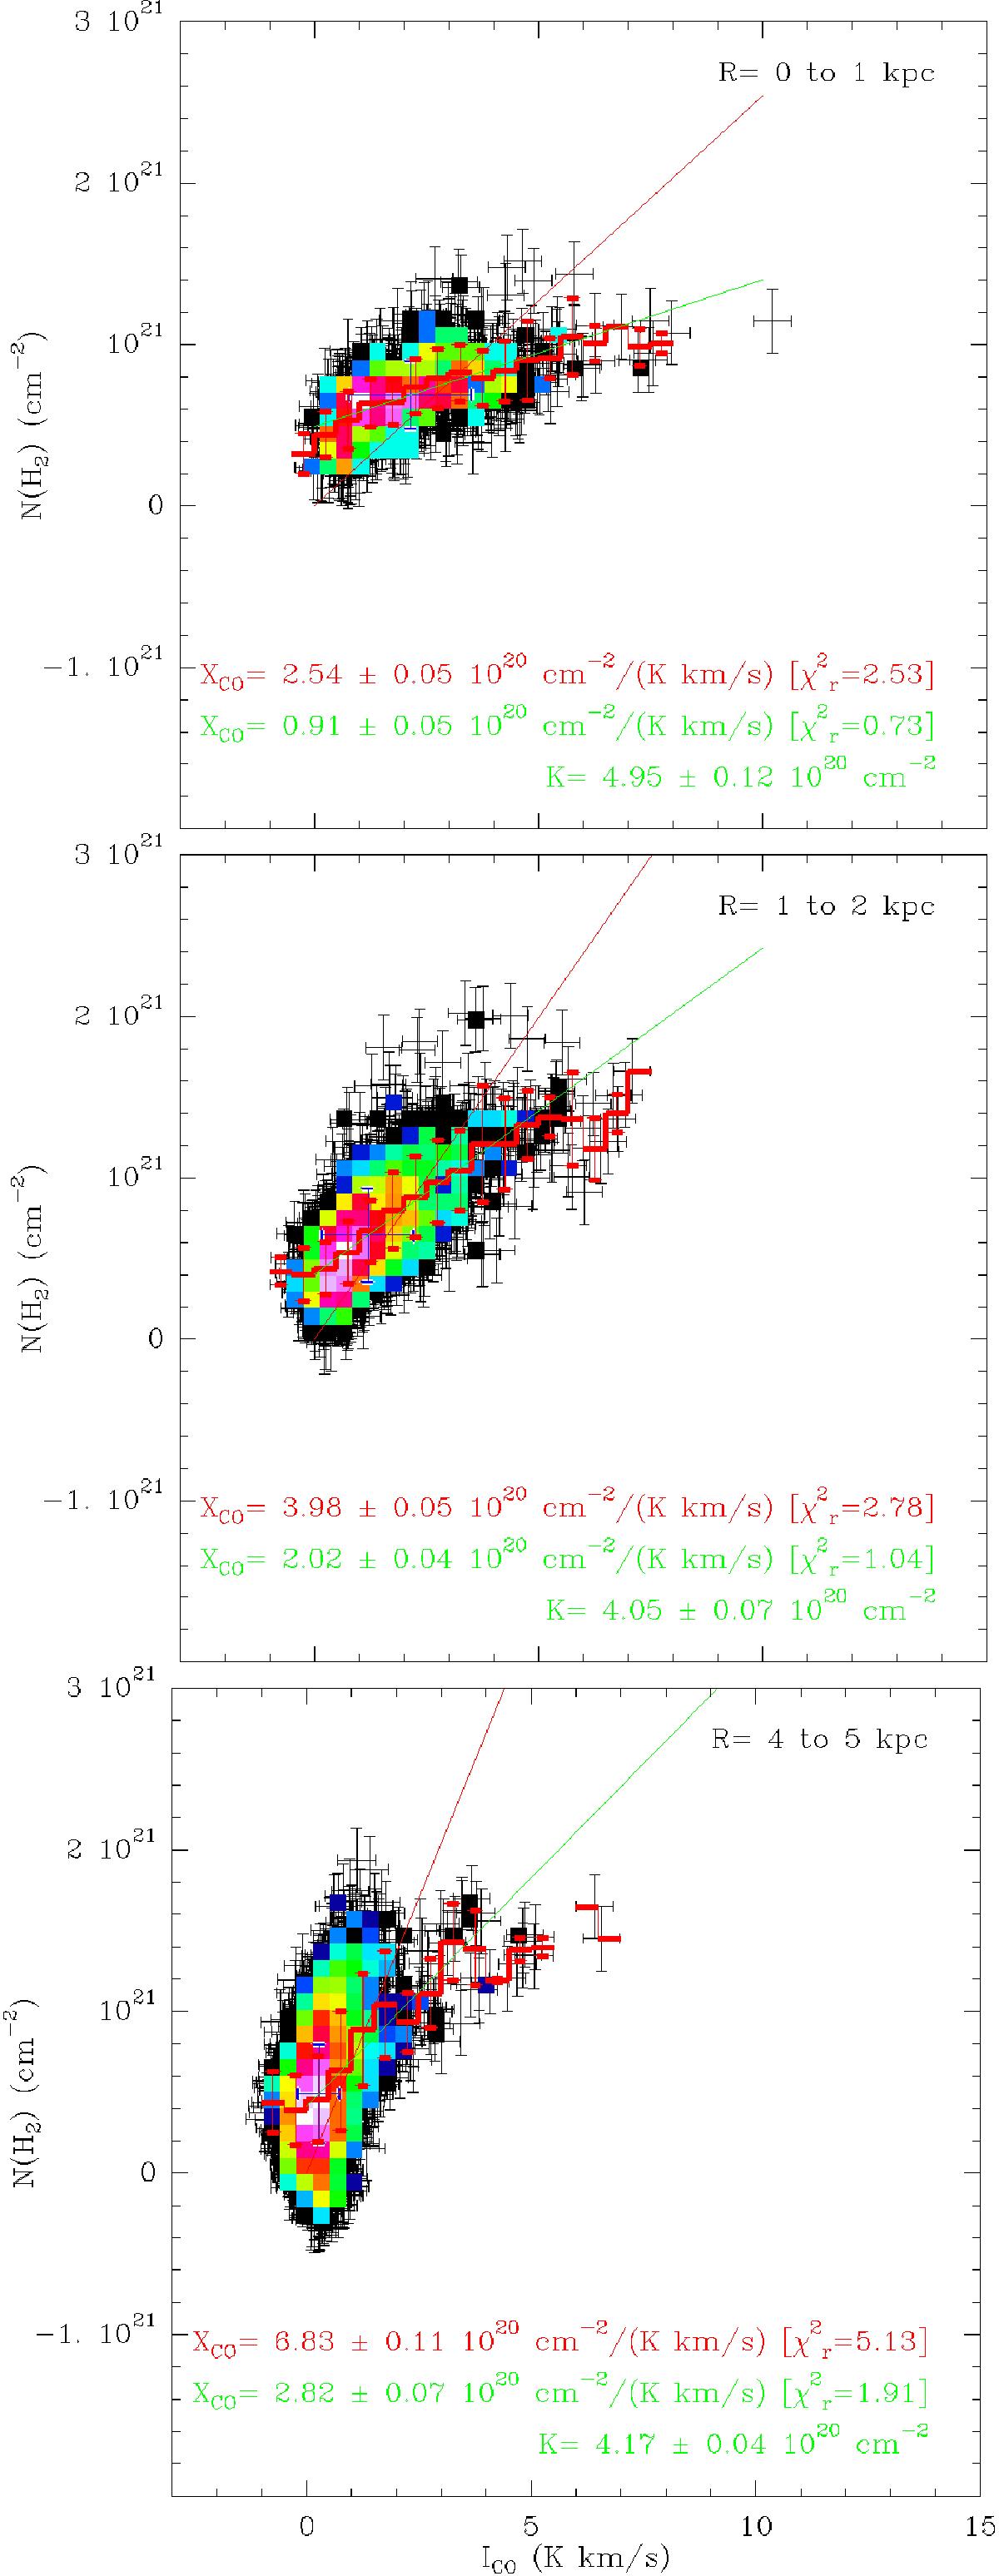
Fit of dust-derived N(H2) as a function of ICO for data in radial intervals between 0 and 1 kpc (top), 1−2 kpc (middle), and 4−5 kpc (bottom). No cut in intensity has been applied. The color scale indicates the density of points and the thick red histogram shows the N(H2) data averaged in bins of 0.5 K km s-1. The thin green line shows an affine fit between N(H2) and ICO; the corresponding fit results are printed in green. The thin red line is a linear fit without an offset; the corresponding fit results are printed in red. Blue cross: average value of the plotted data.
Current usage metrics show cumulative count of Article Views (full-text article views including HTML views, PDF and ePub downloads, according to the available data) and Abstracts Views on Vision4Press platform.
Data correspond to usage on the plateform after 2015. The current usage metrics is available 48-96 hours after online publication and is updated daily on week days.
Initial download of the metrics may take a while.