Fig. 10
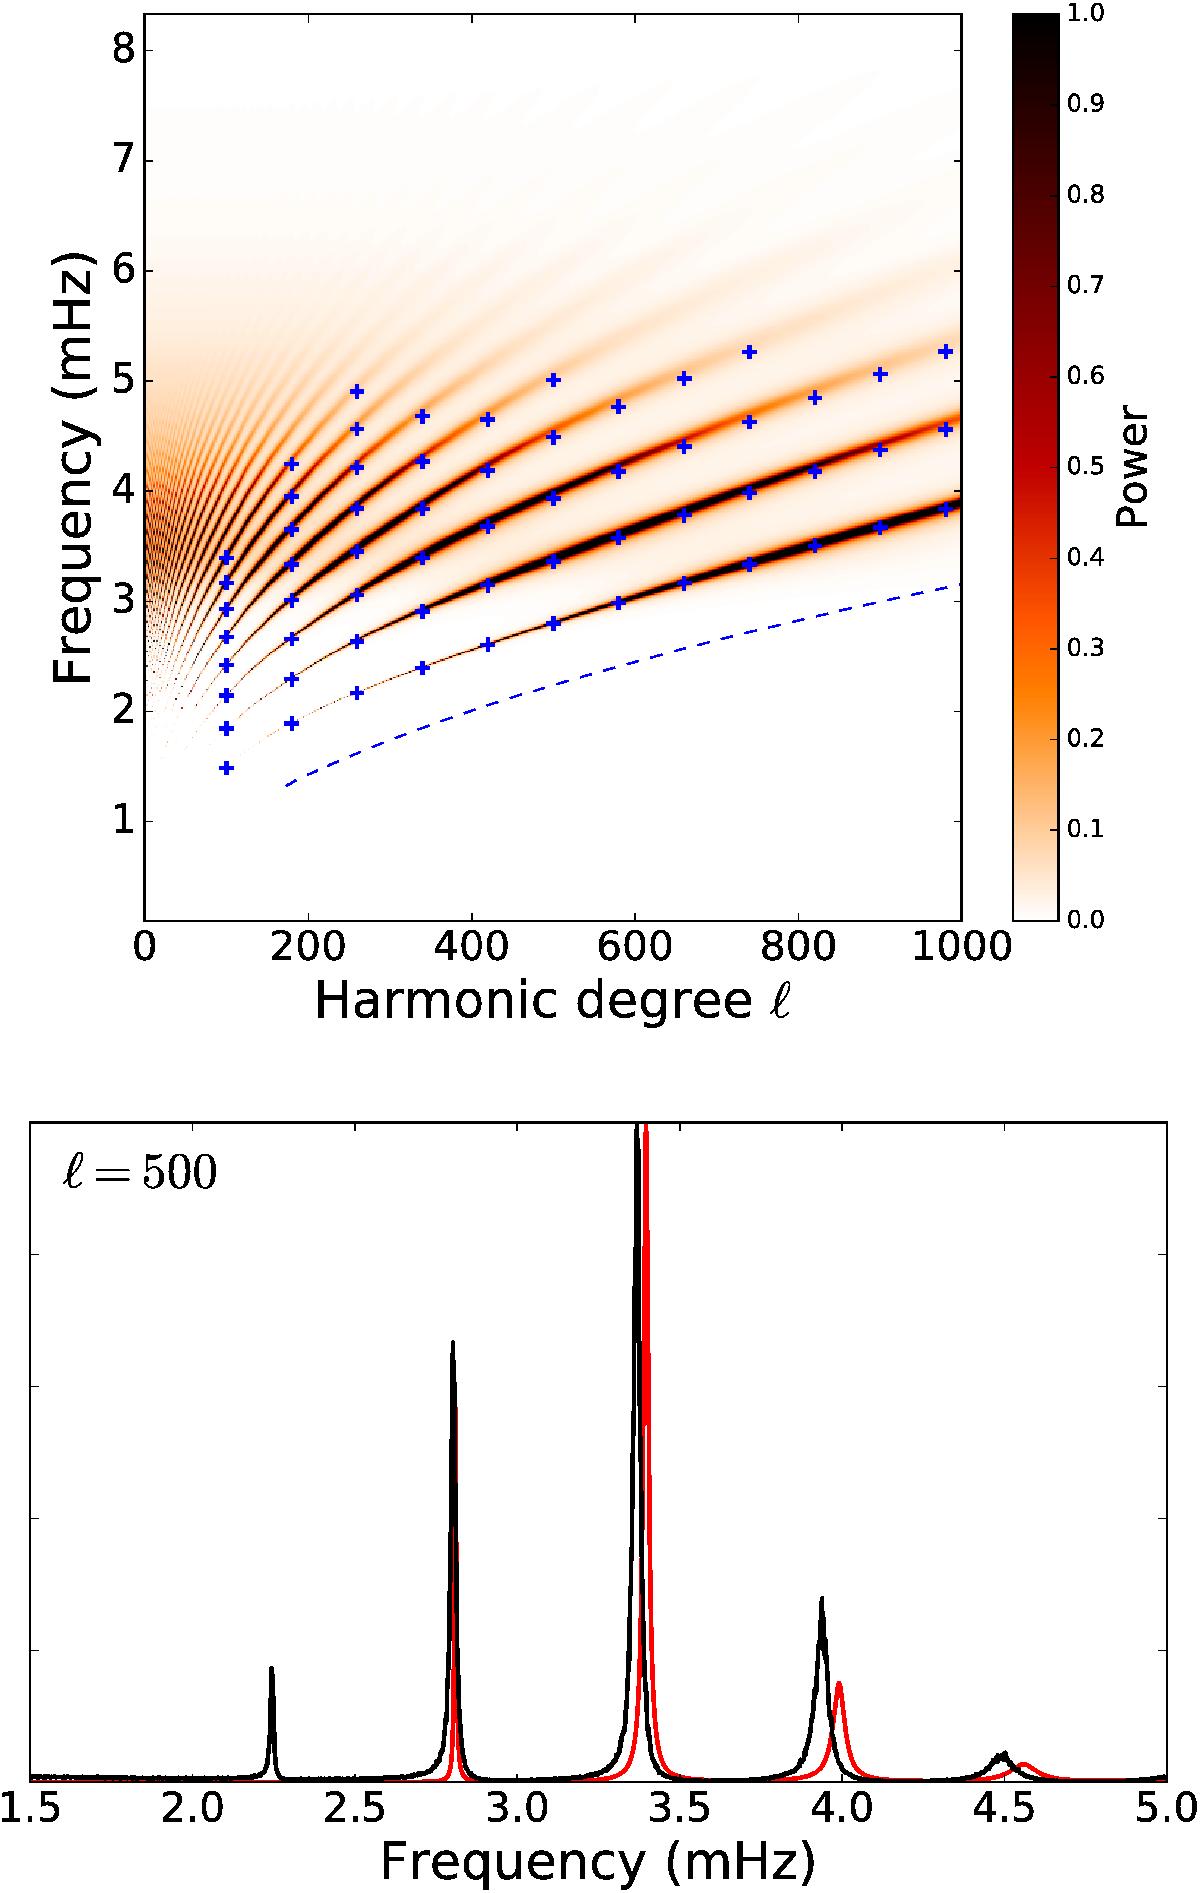
Top: power spectrum computed at the solar surface. The blue crosses indicate the position of the p1–p8 modes reported by Korzennik et al. (2013), while the blue dashed line shows the observed f-mode ridge which is missing in this simulation owing to the lack of a gravitational term. Bottom: comparisons of the simulated power spectrum (red) and HMI data (black) at ℓ = 500. The small misalignment of the simulated ridges from the observations are due to imperfect modeling of surface layers in Model S (i.e., surface effects, Rosenthal et al. 1999).
Current usage metrics show cumulative count of Article Views (full-text article views including HTML views, PDF and ePub downloads, according to the available data) and Abstracts Views on Vision4Press platform.
Data correspond to usage on the plateform after 2015. The current usage metrics is available 48-96 hours after online publication and is updated daily on week days.
Initial download of the metrics may take a while.