Fig. 11
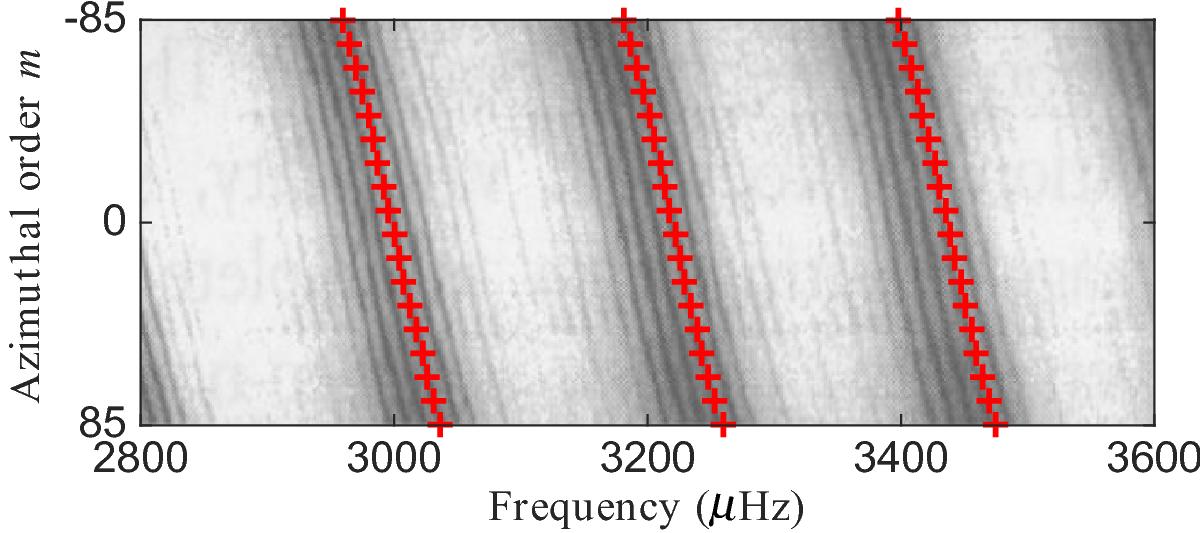
Section of the power spectrum ![]() for harmonic degree ℓ = 85 around frequency 3.2 mHz (n = 7–9). Red crosses are mode frequencies of the rotationally split p-modes from the first Montjoie simulation in Table 1. For comparison, the gray scale image shows the GONG observational power spectrum taken from the paper by Hill et al. (1996). Darker shades indicate larger values of the power. We note the side lobes in the observations due to aliasing from observing half of the Sun. The slope (a1) of the frequencies with m is due to the average rotation rate, while the curvature (a3) indicates differential rotation (slower rotation near the poles).
for harmonic degree ℓ = 85 around frequency 3.2 mHz (n = 7–9). Red crosses are mode frequencies of the rotationally split p-modes from the first Montjoie simulation in Table 1. For comparison, the gray scale image shows the GONG observational power spectrum taken from the paper by Hill et al. (1996). Darker shades indicate larger values of the power. We note the side lobes in the observations due to aliasing from observing half of the Sun. The slope (a1) of the frequencies with m is due to the average rotation rate, while the curvature (a3) indicates differential rotation (slower rotation near the poles).
Current usage metrics show cumulative count of Article Views (full-text article views including HTML views, PDF and ePub downloads, according to the available data) and Abstracts Views on Vision4Press platform.
Data correspond to usage on the plateform after 2015. The current usage metrics is available 48-96 hours after online publication and is updated daily on week days.
Initial download of the metrics may take a while.